
PSGUSDT Breaks Key Averages, Fails to Rally on Rising Volume
Summary
• Price declined from 0.783 to 0.771 over 24 hours amid bearish momentum.
• Key support at 0.766 was tested, with resistance around 0.78–0.785 appearing relevant.
• Volume spiked during the overnight decline, but price failed to recover on rising turnover.
• RSI entered oversold territory around 30, suggesting limited downward momentum.
• Volatility expanded as price broke below key moving averages and Bollinger Bands mid-range.
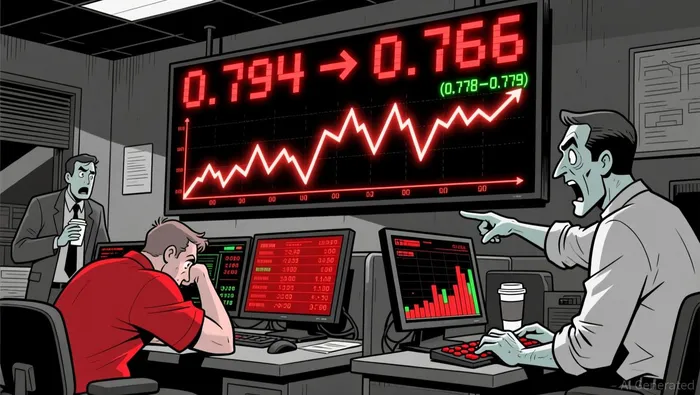
Paris Saint-Germain Fan Token/Tether (PSGUSDT) opened at 0.783 on March 18 at 12:00 ET, reaching a high of 0.794 and a low of 0.766 before closing at 0.771 by the same time on March 19. Total 24-hour volume was approximately 159,430.62, with notional turnover of around $124,616.80.
Structure & Moving Averages
Price action on the 5-minute chart showed a clear breakdown below the 20- and 50-period moving averages, reinforcing bearish sentiment. The 50-period moving average at ~0.778 and 20-period at ~0.779 acted as a barrier during early recovery attempts. On a daily chart, the 50-period line is near 0.78, and the 200-period sits higher, suggesting a longer-term bearish bias.
Momentum and Volatility
Momentum, as measured by MACD, remained negative throughout most of the 24-hour window, with a bearish crossover observed in the early hours of March 19. RSI dropped below 30. entering oversold territory, but failed to show a bullish reversal. Bollinger Bands widened as price drifted lower, with the last close sitting near the lower band, suggesting potential for a short-term bounce.
Volume and Turnover Divergence
Volume spiked during the overnight selloff, particularly around the 0.77–0.775 range, indicating increased selling pressure. However, price failed to recover on rising turnover, suggesting weak conviction in buyers. A divergence emerged between the final upward tick and volume, where higher prices coincided with lower trading activity, raising questions about the strength of any near-term rally.
Key Patterns and Fibonacci Levels
A bearish engulfing pattern formed near 0.781–0.778, followed by a long bearish candle at 0.774–0.775 that reinforced the downtrend. Fibonacci retracement levels from the 0.794 high to the 0.766 low suggest 38.2% at 0.779 and 61.8% at 0.771 as key levels. Price appears to have found a near-term floor at the 61.8% level, potentially setting up for a test of the 0.766 support zone.
Looking ahead, traders should watch for a potential bounce off 0.766 or a break below that level, which could extend the correction. However, caution is warranted as momentum remains bearish and volatility is elevated.
Decoding market patterns and unlocking profitable trading strategies in the crypto space
Latest Articles
Stay ahead of the market.
Get curated U.S. market news, insights and key dates delivered to your inbox.

AInvest
PRO
AInvest
PRO
Comments
No comments yet