
Progressive (PGR) Shares Drop 5.28% on Bearish Engulfing Pattern and Death Cross as Oversold RSI Hints at Potential Bounce from $204.46 Support
Generated by AI AgentAinvest Technical RadarReviewed byAInvest News Editorial Team
Tuesday, Jan 13, 2026 8:17 pm ET2min read
PGR-- Aime Summary
The recent 5.28% drop coincided with a surge in volume (4.09 million shares), validating the bearish move. However, subsequent sessions show declining volume despite further declines, signaling waning bearish conviction. A surge in volume on a rebound above $210.00 could confirm a short-term bottom, whereas muted volume would suggest lingering seller dominance.
Candlestick Theory
The recent 5.28% decline in The ProgressivePGR-- (PGR) on January 13, 2026, forms a bearish 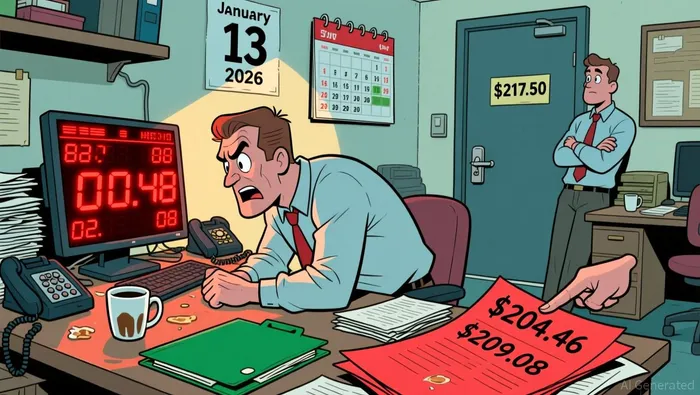 engulfing pattern, suggesting strong downward momentum. Key support levels emerge around $204.46 (recent low) and $209.08 (December 7 low), while resistance aligns with the January 12 high of $217.50. A potential bullish reversal may occur if prices retest the $204.46 level with higher volume, but a break below this could target the next support at $203.00, based on Fibonacci retracement levels.
Moving Average Theory
The 50-day moving average (approximately $223.00) has crossed below the 200-day MA ($235.00), forming a bearish "death cross." The 100-day MA ($227.00) further reinforces the downtrend, as the current price ($205.06) trades below all three, indicating bearish control. Short-term traders may watch for a retest of the 50-day MA as a potential entry point, though a sustained close above $223.00 would signal weakening bearish momentum.MACD & KDJ Indicators
The MACD histogram has turned negative sharply, with the line crossing below the signal line, confirming bearish momentum. The stochastic oscillator (KDJ) shows an oversold reading (K at 15, D at 20), suggesting a potential near-term rebound. However, the divergence between the K line and price action—where K fails to rise despite a minor bounce—hints at weak conviction in the oversold condition.Bollinger Bands
Volatility has expanded following the recent selloff, with the price near the lower band ($204.46–$215.99 range). A break above the mid-band ($210.00) could trigger a mean reversion trade, while a continued slide below the lower band may indicate prolonged weakness. The 20-day volatility (ATR) of ~$6.50 underscores the heightened risk of extended moves.Volume-Price Relationship
The recent 5.28% drop coincided with a surge in volume (4.09 million shares), validating the bearish move. However, subsequent sessions show declining volume despite further declines, signaling waning bearish conviction. A surge in volume on a rebound above $210.00 could confirm a short-term bottom, whereas muted volume would suggest lingering seller dominance.
Relative Strength Index (RSI)
The 14-day RSI stands at 25, confirming oversold territory. While this may attract buyers, caution is warranted due to the RSI’s divergence from price action—RSI has not formed a lower low despite the January 9 low. A close above 35 would suggest improving momentum, but a failure to break above 40 may prolong the consolidation phase.Fibonacci Retracement
Applying Fibonacci levels to the December 2025 high ($283.01) to the January 2026 low ($204.46), key retracement levels include 61.8% ($235.00) and 78.6% ($245.00). The current price ($205.06) aligns with the 23.6% retracement level, indicating a potential support zone. A break below $204.46 would target the 38.2% level ($193.00), but this scenario remains low-probability without a surge in bearish volume.Conclusion
The technical landscape for The Progressive highlights a confluence of bearish signals—death cross, bearish engulfing patterns, and oversold RSI—yet divergences in stochastic and RSI suggest potential for a short-term rebound. Traders should monitor volume dynamics and Fibonacci support levels for entry points, while cautioning against overreliance on oversold conditions without confirmatory price action.If I have seen further, it is by standing on the shoulders of giants.
Latest Articles
Stay ahead of the market.
Get curated U.S. market news, insights and key dates delivered to your inbox.
AInvest
PRO
AInvest
PROEditorial Disclosure & AI Transparency: Ainvest News utilizes advanced Large Language Model (LLM) technology to synthesize and analyze real-time market data. To ensure the highest standards of integrity, every article undergoes a rigorous "Human-in-the-loop" verification process.
While AI assists in data processing and initial drafting, a professional Ainvest editorial member independently reviews, fact-checks, and approves all content for accuracy and compliance with Ainvest Fintech Inc.’s editorial standards. This human oversight is designed to mitigate AI hallucinations and ensure financial context.
Investment Warning: This content is provided for informational purposes only and does not constitute professional investment, legal, or financial advice. Markets involve inherent risks. Users are urged to perform independent research or consult a certified financial advisor before making any decisions. Ainvest Fintech Inc. disclaims all liability for actions taken based on this information. Found an error?Report an Issue

ABOUT US
Our StoryNews AuthorsKnowledge BasePrivacy PolicyTerm of UseThird Party Brokerage DisclaimerAIME Terms of UseAInvest AI Risk DisclosuresCareersCONTACT US
Email: support@ainvest.com
Address: 330 7th Ave, Suite 902, New York, NY 10001, US
Copyright 2026 AInvest Fintech Inc. All rights reserved.
Comments
No comments yet