
Price & Sentiment Dislocate: 3 Rare Buy Signals Emerge
Be Greedy When Others are Fearful
Every major stock market bottom has been marked by extremes. Volatility hits a fever pitch, sentiment sours to extreme fear among investors, and market breadth (participation) becomes feeble. Most recently, major volatility spikes and end-of-world sentiment marked the lows of the ‘Liberation Day’ and COVID-19-induced bear markets. However, in rare instances, extreme readings in technical and market indicators can occur during “garden variety corrections”, where the S&P 500 Index and the other major indices are still within shouting distance of all-time highs. Currently, this is exactly what is occurring in the stock market. Although the S&P 500 Index and Nasdaq are each within 6% of all-time highs, investors are extremely fearful. Below are 3 extreme market readings that signal a bottom is nearby.
The McClellan Oscillator is Extremely Oversold
Market breadth, or participation, is one way to gauge how extreme market selling is. When the number of advancers reaches a very low level, it can signal to savvy investors that panic selling is underway, and sellers are likely to be exhausted soon. The McClellan Oscillator measures the Net Advances (Advances-Declines) on the New York Stock Exchange (NYSE) or S&P 500 (SPX). According to data from X user Subu Trade (@SubuTrade), “despite being within 5% of an all-time high, the SPX McClellan Oscillator is extremely oversold.” “This setup has occurred 10 times previously, and SPX was higher every single time one month later with an average gain of 3.2%.”
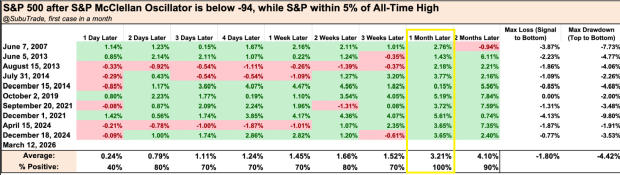
Image Source: @subutrade
Meanwhile, yesterday, the NYSE McClellan Oscillator reached its lowest level since the ‘Liberation Day’ market bottom in April 2025.
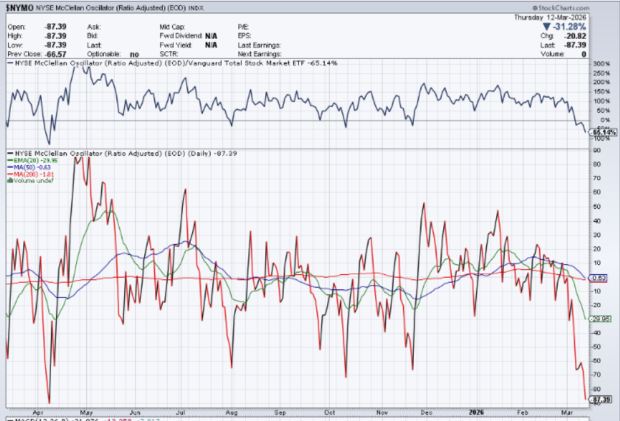
Image Source: StockCharts.com
Fear/Greed Index Hits “Extreme Fear
The CNN “Fear & Greed” Index combines seven different indicators to monitor stock market behavior. The index uses market momentum, stock price strength, stock price breadth, put and call options, junk bond demand, market volatility, and safe haven demand to “gauge the mood of the market.” Despite the subdued correction in equities, the CNN Fear/Greed Index registered its first “Extreme Fear” reading in 2026.

Image Source: CNN
Active Investor Exposure is At Lowest Levels Since Mid-2025
The National Association of Active Investment Managers (NAAIM) is a survey that represents the average exposure to U.S. Equity markets as reported by its members. NAAIM exposure printed its lowest level since May 2025.
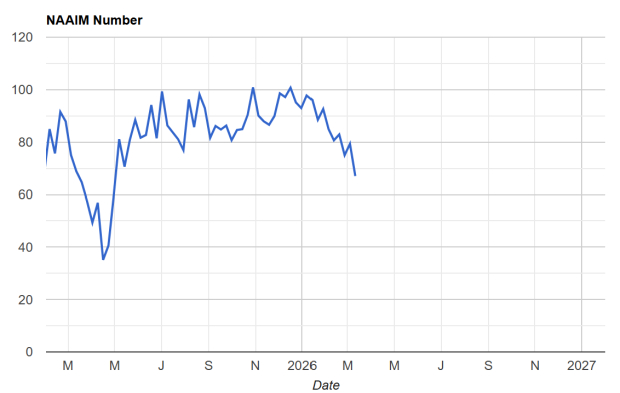
Image Source: NAAIM
What to Buy?
The indicators described in this article suggest that the market is ready to continue its bullish phase. Investors should buy the stocks that have held up the best during the market downturn. One group with stellar fundamentals and technical action to watch is the AI infrastructure stocks, which include names like Nebius (NBIS), IREN (IREN), Sandisk (SNDK), Micron (MU), and Bloom Energy (BE).
Bottom Line
Market history proves that the most rewarding entries occur when the technical “rubber band” is stretched to its limit and the crowd is bracing for a crash that hasn’t arrived. With breadth and sentiment indicators at extremes, now is the time for investors to pay attention.
Just Released: Zacks Top 10 Stocks for 2026
Hurry – you can still get in early on our 10 top tickers for 2026. Handpicked by Zacks Director of Research Sheraz Mian, this portfolio has been stunningly and consistently successful.
From inception in 2012 through November, 2025, the Zacks Top 10 Stocks gained +2,530.8%, more than QUADRUPLING the S&P 500’s +570.3%.
Sheraz has combed through 4,400 companies covered by the Zacks Rank and handpicked the best 10 to buy and hold in 2026. You can still be among the first to see these just-released stocks with enormous potential.
See New Top 10 Stocks >>Want the latest recommendations from Zacks Investment Research? Today, you can download 7 Best Stocks for the Next 30 Days. Click to get this free report
Micron Technology, Inc. (MU): Free Stock Analysis Report
Sandisk Corporation (SNDK): Free Stock Analysis Report
Bloom Energy Corporation (BE): Free Stock Analysis Report
IREN Limited (IREN): Free Stock Analysis Report
Nebius Group N.V. (NBIS): Free Stock Analysis Report
This article originally published on Zacks Investment Research (zacks.com).
Zacks is the leading investment research firm focusing on equities earnings estimates and stock analysis for the individual investor, including stock picks, stock screening, portfolio stock tracker and stock screeners. Copyright 2006-2026 Zacks Equity Research, Inc. editor@zacks.com (Manaing editor) webmaster@zacks.com (Webmaster)
Latest Articles
Stay ahead of the market.
Get curated U.S. market news, insights and key dates delivered to your inbox.


AInvest
PRO
AInvest
PRO
Comments
No comments yet