
Potential Correction Ahead!Economic Index VS. S&P 500
Written byWallstreet Insight
Wednesday, Jul 17, 2024 6:43 am ET1min read
Since 2018, there has been a strong correlation between the Bloomberg Economic Surprise Index and the S&P 500 P/E ratio.
However, as we entered 2024, the surprise index has been steadily declining, while the US stock market has displayed wild performance. How long can this disparity between the two sides persist?
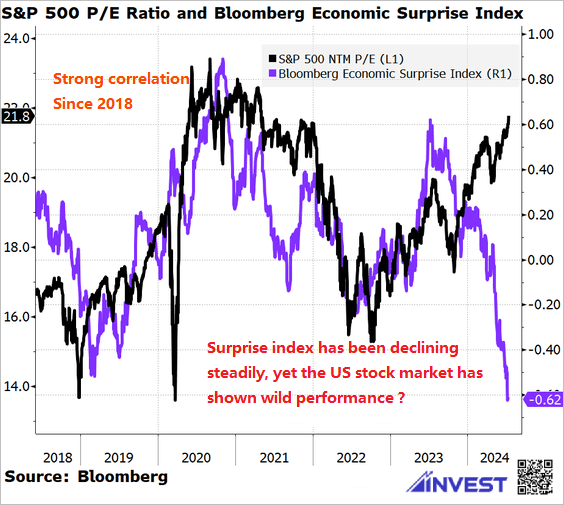
According to historical trends, the five-year average for the S&P 500 P/E ratio is approximately 18.8. If it returns to this average, the S&P 500 index could face a correction of approximately 15%!
Expert analysis on U.S. markets and macro trends, delivering clear perspectives behind major market moves.
Latest Articles
Stay ahead of the market.
Get curated U.S. market news, insights and key dates delivered to your inbox.


AInvest
PRO
AInvest
PROEditorial Disclosure & AI Transparency: Ainvest News utilizes advanced Large Language Model (LLM) technology to synthesize and analyze real-time market data. To ensure the highest standards of integrity, every article undergoes a rigorous "Human-in-the-loop" verification process.
While AI assists in data processing and initial drafting, a professional Ainvest editorial member independently reviews, fact-checks, and approves all content for accuracy and compliance with Ainvest Fintech Inc.’s editorial standards. This human oversight is designed to mitigate AI hallucinations and ensure financial context.
Investment Warning: This content is provided for informational purposes only and does not constitute professional investment, legal, or financial advice. Markets involve inherent risks. Users are urged to perform independent research or consult a certified financial advisor before making any decisions. Ainvest Fintech Inc. disclaims all liability for actions taken based on this information. Found an error?Report an Issue

ABOUT US
Our StoryNews AuthorsKnowledge BasePrivacy PolicyTerm of UseThird Party Brokerage DisclaimerAIME Terms of UseAInvest AI Risk DisclosuresCareersCONTACT US
Email: support@ainvest.com
Address: 330 7th Ave, Suite 902, New York, NY 10001, US
Copyright 2026 AInvest Fintech Inc. All rights reserved.
Comments
No comments yet