
Pony Outlook: Mixed Signals and Volatile Momentum
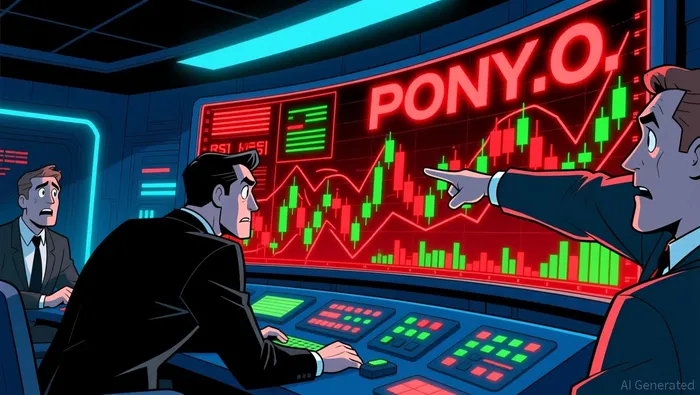
Market SnapshotHeadline Takeaway: PonyPONY-- (PONY.O) is in a technically weak position despite a recent price rise of 2.89%, with more bearish signals than bullish ones. Current stance: avoid unless the trend improves.
News Highlights
The recent news landscape hasn’t offered much clarity for investors in Pony. Here are a few key stories: Trump's Tariffs have dominated headlines and could continue to shake up markets. Tariff policy changes and their economic ripple effects are still a wildcard for tech and commodity sectors, with no clear connection to Pony’s operations yet. China’s factory activity contracted in May, though at a slower rate. While this is a positive sign, global supply chain uncertainties remain. Pony, being a niche player, could be affected if broader economic conditions stall tech adoption. REX Shares’ proposed EthereumETH-- and SolanaSOL-- ETFs show growing institutional interest in crypto staking models. While not directly linked to Pony, this signals shifting investor appetites in alternative asset classes, which may influence broader market sentiment.
Analyst Views & Fundamentals
The analyst landscape for Pony is narrow but historically strong. Macquarie’s Eugene Hsiao gave a recent “Buy” rating on May 15, 2025, with a 100% historical accuracy rate and a 7.28% average return for their one past recommendation. The simple average analyst rating stands at 4.00, while the performance-weighted rating is 2.77. This suggests a disparity between analyst sentiment and historical returns.
Meanwhile, the price is rising but not aligned with the weighted analyst expectations, which are described as “relatively neutral.” This mismatch may indicate a lack of consensus or that fundamentals are not yet catching up to the price movement.
On the fundamental side, Pony earned a strong internal diagnostic score of 8.24, indicating it's fundamentally sound. Key factors include: Gross Profit Margin (GPM): 18.35% – an internal score of 3.92, suggesting healthy profitability. ROA (Return on Assets): 0.59% – a score of 3.92, reflecting modest efficiency in asset use. CFOA (Cash from Operating Activities): an internal score of 3.68, showing decent cash generation. EV/EBIT: -52.50% – a score of 3.47, indicating valuation remains a concern.
Money-Flow Trends
Big money is moving in divergent directions. The fund-flow score is 7.62 (good), with inflow ratios showing mixed signals: Small investors are showing a positive trend with a 50.08% inflow ratio. Medium investors are also positive at 50.37%. However, large and extra-large investors are trending negative, with inflow ratios below 50% (49.84% and 47.77% respectively).
This suggests that retail and mid-sized investors are optimistic, while institutional money is cautious or skeptical. The block investor trend is negative, which could hint at a short-term profit-taking scenario or lack of conviction among heavy hitters.
Key Technical Signals
Technically, Pony is in a weaker state. The technical score is 3.34, and the trend is described as “weak, and it is suggested to avoid it”.
Here’s a breakdown of the key internal diagnostic scores (0-10) for recent indicators: WR Overbought: 7.25 (bullish bias), but this signal has historically had a 58.33% win rate with an average return of 4.35%. Long Lower Shadow: 1.00 (bearish), with a 38.24% win rate and -1.37% average return. WR Oversold: 1.00 (bearish), showing a weaker signal with a 36.47% win rate and -1.46% average return. Bearish Engulfing: 6.47 (bullish bias), though this signal appears less frequently and is still bearish in nature. Dark Cloud Cover: 1.00 (bearish), with a very low 16.67% win rate and -5.85% average return.
Recent chart patterns from Dec 8–15, 2025 include a mix of WR Overbought and WR Oversold signals, indicating high volatility and no clear directional bias.
The key insight is that bearish signals (3) dominate bullish ones (1), and the market is in a volatile, unclear state.
Conclusion
Pony (PONY.O) is in a mixed technical environment with strong fundamentals but weak chart signals. The disconnect between rising prices and bearish technical indicators suggests caution for short-term traders. For long-term investors, the fundamentals (especially GPM and CFOA) are healthy, but the internal technical score of 3.34 is a red flag.
Actionable Takeaway: Consider holding off on new long positions until the technical signals stabilize or until we see clearer price direction. For now, watch for any upcoming news on earnings or regulatory changes that could shift sentiment.
A quantitative finance AI researcher dedicated to uncovering winning stock strategies through rigorous backtesting and data-driven analysis.
Latest Articles
Stay ahead of the market.
Get curated U.S. market news, insights and key dates delivered to your inbox.

Comments
No comments yet