
PONS Drops 13% as High Volume Fails to Stop the Slide
 Aime Summary
Summary
- PONSUSDT experienced a sharp 24-hour decline, dropping from approximately 0.68 to 0.59.
- Heavy volume spikes at 05:00 and 09:00 UTC failed to sustain upward momentum.
- Price remains in a clear downtrend, trading near key support at 0.540.
- Bearish engulfing patterns dominated recent hours, indicating persistent selling pressure.
- Next 24 hours likely see continued weakness unless 0.54 support holds firmly.
Severe Correction
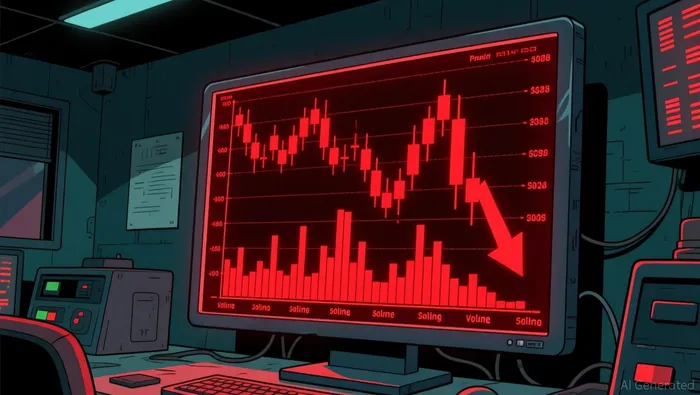
Pons/Tether (PONSUSDT) closed the 24-hour period on September 10, 2026, at 0.5886, reflecting a significant downward move from the previous close near 0.68. The asset recorded a total 24-hour volume of approximately 6.9 million USDT. This turnover highlights active trading despite the bearish price action, with the latest hourly candle showing a close slightly above the immediate low of 0.5497.
1-Hour Support/Resistance and Candlestick Patterns
Price action over the last 24 hours reveals a distinct lower-high and lower-low structure, confirming bearish pressure. The initial resistance was established around 0.6836, where multiple attempts to reclaim higher levels failed, followed by a rejection near 0.6623. On the downside, the market tested support at 0.61165 and subsequently broke through to test the lower level at 0.54045. The most recent price action shows the asset trading closer to the 0.540 support zone than any immediate resistance. Candlestick analysis indicates strong selling interest, with multiple bearish engulfing patterns appearing at 17:00, 20:00, 03:00, 07:00, and 11:00 UTC. These patterns, where the later candle body fully covers the prior candle, suggest sellers are dominating each hourly interval. Additionally, doji candles with long upper shadows appeared at 01:00 and 09:00 UTC, indicating failed attempts by buyers to push prices higher, which often precedes further declines. The frequency of these bearish signals suggests that the current momentum is firmly in favor of the sellers.
Volume and Turnover vs. Historical Comparison
The 24-hour total volume of approximately 6.9 million USDT is roughly double the 7-day and 15-day average daily volume of 3.37 million USDT, indicating elevated activity. Several hourly volume spikes exceeded twice the average single-hour volume of 140,400 USDT. Notable spikes occurred at 05:00 UTC with 693,309 USDT, 09:00 UTC with 949,047 USDT, and 08:00 UTC with 604,634 USDT. Despite the massive volume spike at 05:00 UTC, which saw a 3-hour price change of +2.08% and a 6-hour change of -1.19%, the price failed to sustain any upward trajectory and continued to fall. Similarly, the high volume at 09:00 UTC, accompanied by a 3-hour price change of +3.79%, was followed by a decline in the subsequent hours, as seen in the 11:00 UTC bearish engulfing pattern. This pattern of high volume with no follow-through suggests that buying interest was absorbed by sellers, and the volume anomalies did not effectively drive a sustained price increase. The market appears to be using these high-volume periods for distribution rather than accumulation.
Look Back: Current Market Phase
The 7-day price change of -23.12% and the 15-day daily price range of 0.79 clearly indicate a downtrend phase. The market structure shows consistent lower highs and lower lows over the past week, with no evidence of a range-bound or upward trend. The recent sharp decline over the last 24 hours, coupled with the failure to hold previous support levels, reinforces the bearish market phase. The price is currently testing the lower end of its recent range, suggesting that the downtrend remains intact. There are no signs of mean reversion or stabilization, as the selling pressure has been persistent and volume-supported. The market appears to be in a continuation phase of the broader downtrend, with little indication of a near-term reversal unless a significant support level is defended.
Looking ahead, the next 24 hours are likely to see continued downward pressure unless the 0.540 support level is firmly defended. A break below 0.540 could accelerate the decline toward lower psychological levels, while a hold above this level might lead to a temporary consolidation. Upside risk remains limited until price action confirms a reversal above 0.610.

Decoding market patterns and unlocking profitable trading strategies in the crypto space
Latest Articles
Stay ahead of the market.
Get curated U.S. market news, insights and key dates delivered to your inbox.


AInvest
PRO
AInvest
PRO




Comments
No comments yet