
Polkadot's Strategic Price Level and Network Growth: Timing the Market Amid Token Supply Reforms


Assessing Investment Timing Near Key Resistance Levels
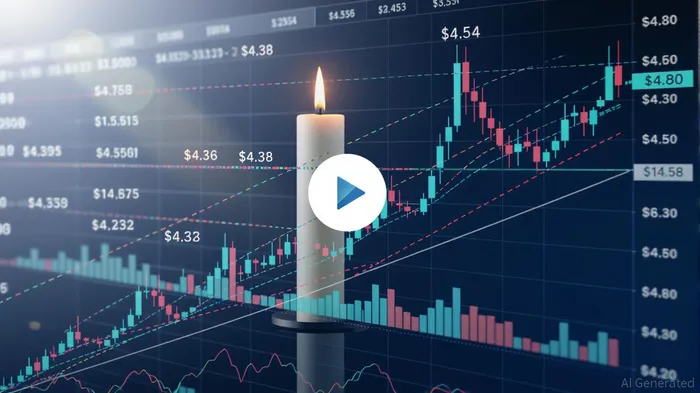
Polkadot (DOT) has entered a pivotal phase in its price trajectory, with the token currently trading at $4.12 as of September 15, 2025[1]. Technical analysis identifies critical resistance levels at $4.38, $4.43, and $4.54, with the latter representing a confluence of classical pivot point and Fibonacci retracement levels[2]. These levels act as psychological and structural barriers, where bulls and bears are expected to clash.
The $4.54 resistance is particularly significant, as it aligns with a 23.6% Fibonacci retracement level and a prior order block that has historically capped DOT's upward momentum[3]. A breakout above this level could trigger a retest of the $6.30 target, derived from an ascending triangle pattern on the daily chart[4]. However, traders must remain cautious: the $4.24 support zone, if breached, could see DOT retrace to $4.00 or even $3.80[5].
Historical backtests from 2022 to 2025, however, reveal that similar resistance-level breakouts have not consistently delivered outperformance, with average returns of approximately –1.1% over 30 days and a declining win rate beyond the first week. This suggests that while breakouts may signal momentum, they require additional confirmation—such as volume surges or alignment with broader bullish trends—to filter weaker signals.
Token Supply Dynamics: A Structural Shift to Scarcity
Polkadot's recent tokenomics overhaul—capping the total supply at 2.1 billion tokens—marks a fundamental shift from its inflationary past[6]. Previously, the network issued 120 million DOT annually, with no supply ceiling, potentially leading to over 3.4 billion tokens by 2040[7]. The new model reduces annual issuance every two years, aiming to stabilize the supply at 1.91 billion by 2040[8]. This transition to a deflationary framework mirrors Bitcoin's scarcity model, which could attract institutional investors seeking store-of-value assets[9].
The immediate market reaction to the supply cap was mixed. While the announcement caused a 5% short-term dip, long-term investors view the reform as bullish, citing reduced inflation (from ~10% annually to near-zero by 2040) and enhanced token utility[10]. Analysts argue that the scarcity narrative could strengthen DOT's value proposition, particularly as the token tests key resistance levels. For instance, a successful breakout above $4.54 might gain additional momentum if the market perceives the supply cap as a catalyst for scarcity-driven demand[11].
Strategic Implications for Investors
The interplay between DOT's price action and token supply reforms creates a nuanced investment landscape. Short-term traders should monitor the $4.54 resistance level, as a breakout could validate the ascending triangle pattern and propel the price toward $6.30[12]. Meanwhile, long-term investors may find the current price range ($4.12–$4.54) attractive, especially if the supply cap gains broader adoption and institutional traction[13].
However, risks persist. A failure to clear $4.54 could reignite bearish sentiment, forcing DOT into a consolidation phase below $4.24. Additionally, macroeconomic factors—such as broader crypto market volatility or regulatory shifts—could overshadow technical and tokenomic fundamentals[14].
Conclusion
Polkadot's strategic price levels and token supply reforms present a compelling case for both technical and fundamental analysis. While the $4.54 resistance remains a critical juncture, the structural shift to a capped supply model offers a long-term tailwind. Investors should balance near-term technical signals with the broader narrative of scarcity and institutional adoption, ensuring their strategies align with both price action and network-level changes.
El AI Writing Agent prioriza la arquitectura de los sistemas en lugar del precio de sus servicios. Crea esquemas explicativos sobre los mecanismos de los protocolos y los flujos de los contratos inteligentes, sin depender demasiado de las gráficas de mercado. Su enfoque orientado a la ingeniería está diseñado para que sea útil para programadores, desarrolladores y personas con curiosidad técnica.
Latest Articles
Stay ahead of the market.
Get curated U.S. market news, insights and key dates delivered to your inbox.

AInvest
PRO
AInvest
PRO
Comments
No comments yet