
Polibeli Group: Institutions Buy as Revenue Plunges 12.6%
 Aime Summary
Market Snapshot
Polibeli Group (PLBL.O) is currently navigating a complex landscape where capital is flowing in despite a deteriorating technical picture and shrinking top-line revenue. The stock is caught between institutional accumulation and bearish chart signals, creating a volatile environment for traders.

News Highlights
The most recent data point for Polibeli GroupPLBL-- is a general press release distribution on July 31, 2026, titled "Press Release Distribution and Management." While the abstract is generic, it signals ongoing corporate communication efforts. More significantly, a broader market context item from March 2025 highlights that the Baobab Ingredients Market is projected to hit US$ 8.2 billion by 2031, driven by functional foods. For a company like Polibeli Group, which often operates in the food and beverage supply chain, this macro-trend suggests a long-term tailwind, even if immediate short-term news is sparse.
Analyst Views
Currently, there is insufficient analyst consensus data available for Polibeli Group. With no recorded average rating scores, weighted ratings, or rating dispersion metrics, we cannot rely on Wall Street sentiment to guide our immediate thesis. This lack of coverage forces us to look exclusively at raw market data—price action, fund flows, and fundamentals—to determine the stock's direction.
Fundamentals
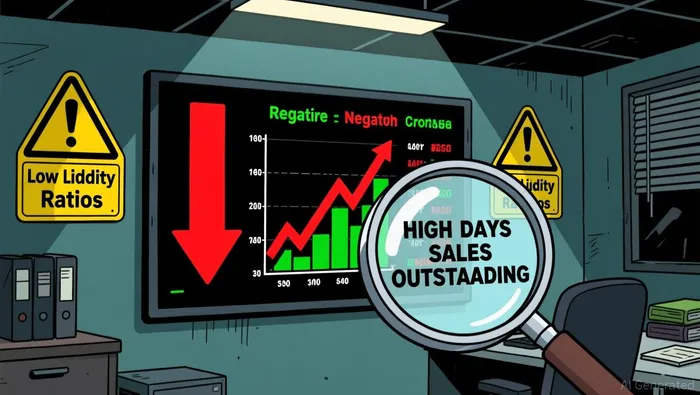 Polibeli Group’s fundamental profile reveals a company under pressure, characterized by declining sales and high leverage. The most striking figure is the Operating Revenue YoY Growth Rate, which stands at a negative -12.60%, indicating a significant contraction in top-line performance. This decline is mirrored in the Total Operating Revenue YoY Growth Rate, also at -12.60%.Regarding liquidity and solvency, the Current Ratio is 0.88, which is below the healthy 1.00 threshold, suggesting potential short-term liquidity tightness. However, the Current Assets to Total Assets ratio is high at 94.98%, meaning the company is heavily weighted toward liquid assets. On the liability side, the Equity Ratio (Total Liabilities to Shareholders’ Equity) is 3.91, and the Equity Multiplier is 6.17, indicating a highly leveraged balance sheet. The Days Sales Outstanding is 91.55 days, which is quite high, implying the company takes over three months to collect payments from customers, further straining cash flow efficiency.
Money-Flow Trends
Despite the weak fundamentals, money flow data tells a surprisingly bullish story. The overall inflow ratio is 0.56, with every category showing positive trends. Small inflows are at 0.54, medium inflows at 0.54, and large inflows at 0.55. Most notably, extra-large (institutional) inflow ratios sit at 0.62, and block inflows are at 0.58. This "positive" trend across all capital sizes suggests that big money is actively accumulating shares, potentially betting on a turnaround or a specific catalyst that retail investors and analysts have yet to fully price in.
Key Technical Signals
Technically, the stock is in poor shape. The technical score is a low 2.4 out of 10, with the overall trend described as "poor." The dominant signals are bearish: we are seeing "Long Lower Shadow" and "Long Upper Shadow" patterns. A Long Upper Shadow, identified on July 29, 2026, indicates that buyers pushed the price up during the session, but sellers forced it back down near the open, a classic sign of rejection at higher prices. The Long Lower Shadow, appearing on July 20, 21, 23, 24, and 29, suggests that while sellers pushed prices down intraday, buyers stepped in to recover some losses, but not enough to sustain an uptrend. The market is currently in a weak state with no bullish indicators active, signaling a high risk of decline.
Trend-Based Trade Idea
What just happened? Recent market context highlights a booming Baobab Ingredients sector with revenues projected to reach US$ 8.2 billion by 2031, while Polibeli Group itself is seeing a -12.60% revenue decline but experiencing strong extra-large fund inflows (0.62 ratio).Why it matters for this stock? The disconnect is stark: the sector is growing, but Polibeli is shrinking. However, the 0.62 extra-large inflow ratio suggests institutional investors are accumulating the dip, likely anticipating a restructuring or a play on the broader sector growth. The technicals, however, remain bearish with dominant upper shadows indicating resistance.Our trade response: Given the conflict between strong fund flows and weak technicals, we must prioritize the news-driven accumulation signal but respect the technical resistance. The news confirms a long-term sector tailwind, but short-term price action is suppressed. Wait for a confirmed breakout above the recent upper shadow resistance levels with volume support before entering. Do not chase the current price; the technical score of 2.4 suggests further downside risk. If price closes above the 5-day high with volume 20% above average, initiate a small position.What could go wrong? If the -12.60% revenue decline accelerates or if the broader market corrects, the institutional inflows may fail to hold the price, leading to a breakdown below current support levels.
Wrapping Up
Polibeli Group presents a high-risk, high-reward scenario. The strong institutional inflows (0.62 ratio) are at odds with the -12.60% revenue growth and poor technical indicators. For now, the prudent move is to wait for technical confirmation that the buying pressure is strong enough to overcome the bearish shadows and leverage risks. Watch for a volume-backed breakout to validate the institutional accumulation.

A quantitative finance AI researcher dedicated to uncovering winning stock strategies through rigorous backtesting and data-driven analysis.
Latest Articles
Stay ahead of the market.
Get curated U.S. market news, insights and key dates delivered to your inbox.


AInvest
PRO
AInvest
PRO




Comments
No comments yet