
PNC Soars 2.75% on Digital Banking Hype and Branch Expansion Momentum
Summary
• PNCPNC-- surges 2.75% to $197.33, outpacing the 1.36% rise in sector leader JPM.
• Institutional ownership hits 83.5%, with CW Advisors boosting stake by 72.3% to $34.58M.
• PNC unveils 2026 digital app overhaul and $2B branch expansion plan by 2030.
• Technicals show bullish momentum: MACD at 1.37, RSI at 63.19, and price above 200D MA.
• PNC’s 52W high of $209.16 looms as critical resistance amid a $2B+ market cap.
• Analysts highlight PNC’s 3.5% yield and 43.93% payout ratio as value drivers.
• Options frenzy: 5380 contracts traded for PNC20251212C195PNC20251212C195--, with 37.95% price change.
• Sector peers like JPM and Fifth Third face M&A-driven volatility in Q4 2025.
• PNC’s Zacks Rank 3 (Hold) clashes with B-rated Value and VGM Style Scores.
• Institutional buying and digital transformation position PNC for sustained outperformance.
• The stock’s 2.75% surge reflects optimismOP-- over 2026 digital upgrades and branch rollouts.
• PNC’s 8.9% YoY revenue growth and $4.35 EPS beat signal operational strength.
• With $1.7B in recent institutional inflows, PNC’s rally may extend beyond short-term.
• A 5% upside to $207.195 could trigger call option premiums to surge 139%.
Digital Overhaul and Branch Expansion Ignite PNC Rally
PNC’s 2.75% surge stems from a dual catalyst: a 2026 digital banking platform overhaul and a $2B branch expansion plan. The redesigned app, launching in H1 2026, promises incremental functionality including digital direct deposit switching and instant debit card issuance. This follows PNC’s migration of all customers to a new digital platform in November 2025, enabling faster feature rollouts. Meanwhile, the bank’s aggressive branch strategy—300 new or renovated locations by 2030—targets Miami, Austin, and Columbus, aiming to boost brand awareness and cross-channel sales. Analysts highlight PNC’s 8.9% YoY revenue growth and $4.35 EPS beat as evidence of operational strength, while institutional investors like CW Advisors added $34.58M in Q3. The rally aligns with PNC’s Zacks 3 (Hold) rating and B-rated Value Style Score, as investors bet on execution of its phygital strategy.
Commercial Banks Rally on M&A Hype as PNC Outpaces JPM
The commercial banking sector is in a bullish phase, driven by a surge in M&A activity. Fifth Third’s $10.9B Comerica deal and Huntington’s $7.4B Cadence Bank acquisition have intensified competition, pushing JPMorgan Chase (JPM) up 1.36% on speculation of further consolidation. PNC’s 2.75% outperformance reflects its unique value proposition: a $2B branch expansion and digital transformation. While JPM benefits from broader market optimism, PNC’s targeted investments in customer experience and physical presence position it to capture market share. The sector’s 52W high of $209.16 for PNC and JPM’s $170B+ market cap highlight divergent strategies—PNC’s phygital focus versus JPM’s scale-driven growth.
Options Playbook: PNC20251212C195 and PNC20251212C197.5PNC20251212C197.5-- for 5% Upside
• MACD: 1.37 (bullish divergence)
• RSI: 63.19 (neutral to overbought)
• 200D MA: 183.73 (price above by 8.5%)
• Bollinger Bands: 194.20 (upper) / 185.99 (middle) / 177.78 (lower)
• Support/Resistance: 182.83–183.10 (30D) / 172.83–173.99 (200D)
• Turnover Rate: 0.209% (healthy liquidity)
• Dynamic PE: 12.39 (undervalued vs. sector)
• Options Volatility: 33.08%–8.05% (attractive for short-term plays)
• Leveraged ETF: N/A (data missing)
• Sector Leader: JPM +1.36% (validates sector strength)
• Key Levels: 197.33 (intraday high) / 192.0 (open) / 145.12 (52W low)
• Positioning: 5380 contracts traded for PNC20251212C195, 12691 for PNC20251212C197.5
• Theta/Gamma: PNC20251212C195 (theta -0.134, gamma 0.097) / PNC20251212C197.5 (theta -0.196, gamma 0.057)
• IV Range: PNC20251212C195 (8.05%) / PNC20251212C197.5 (21.32%)
• Leverage: PNC20251212C195 (73.39%) / PNC20251212C197.5 (71.79%)
• Delta: PNC20251212C195 (0.826) / PNC20251212C197.5 (0.504)
• Turnover: PNC20251212C195 (5380) / PNC20251212C197.5 (12691)
• Price Change: PNC20251212C195 (37.95%) / PNC20251212C197.5 (139.13%)
• Payoff at 5% Upside: PNC20251212C195 (max(0, 207.195 - 195) = $12.195) / PNC20251212C197.5 (max(0, 207.195 - 197.5) = $9.695)
• Key Stats: PNC20251212C195 (IV: 8.05% - low volatility, Leverage: 73.39% - high reward, Delta: 0.826 - in-the-money, Theta: -0.134 - time decay, Gamma: 0.097 - sensitivity to price movement). PNC20251212C197.5 (IV: 21.32% - moderate volatility, Leverage: 71.79% - high reward, Delta: 0.504 - at-the-money, Theta: -0.196 - time decay, Gamma: 0.057 - sensitivity to price movement).
• Why PNC20251212C195? High leverage (73.39%) and moderate delta (0.826) offer a 37.95% price change with 5380 contracts traded. A 5% upside to $207.195 yields $12.195 per contract, ideal for aggressive bulls.
• Why PNC20251212C197.5? Strong gamma (0.057) and high turnover (12691) ensure liquidity. A 5% move to $207.195 generates $9.695 per contract, balancing risk and reward.
• Action: Aggressive bulls may consider PNC20251212C195 into a breakout above $197.33, while PNC20251212C197.5 offers a safer play with 139.13% price change potential.
Backtest The Pnc Financial Stock Performance
Below is an interactive event-backtest module that summarises the performance of PNC shares after every ≥ 3 % intraday surge since 2022. Key metrics—including win-rate, cumulative excess return and the day-by-day return profile—are all available in the panel; click to explore details.Interpretation highlights (30-day holding horizon):• Sample: 23 events met the ≥ 3 % intraday-gain condition from Jan 2022 to 3 Dec 2025. • Average cumulative return after 5 trading days: +0.41 % (benchmark +0.02 %). • Peak average outperformance occurs around day 22–23 (~+2.3 % vs benchmark +0.03 %). • Win-rate hovers near 60 – 66 % for the first two weeks, then trends toward 50 %. • Statistical tests show no days with high significance—edge is positive but not yet conclusive.Practical takeaways:1. Short-term momentum: modest positive drift in the first fortnight; may suit quick swing trades rather than long holds. 2. Diminishing edge: by day 30, excess return falls back to ~0.5 %. Consider profit-taking within 10-15 trading days. 3. Position sizing & risk: given moderate edge and limited significance, pair with risk controls (e.g., stop-loss 3–4 %) if deploying capital.Feel free to dive into the chart for deeper insights or let me know if you’d like to refine parameters (e.g., different surge thresholds, alternative holding windows, or adding stop-loss/take-profit rules).
PNC’s 2.75% Rally: A Strategic Bet on Digital and Branch Expansion
PNC’s 2.75% surge reflects investor confidence in its 2026 digital overhaul and $2B branch expansion. Technicals show bullish momentum with MACD at 1.37 and RSI at 63.19, while options data highlights high leverage and liquidity in key contracts. The stock’s 8.9% YoY revenue growth and 43.93% payout ratio reinforce its value proposition. Sector leader JPM’s 1.36% rise validates broader banking sector strength, but PNC’s phygital strategy offers unique upside. Watch for a breakout above $197.33 or a 5% move to $207.195, which could trigger 37.95% gains in PNC20251212C195. Aggressive bulls should target PNC20251212C195 into a bounce above $197.33, while PNC20251212C197.5 offers a safer play with 139.13% price change potential.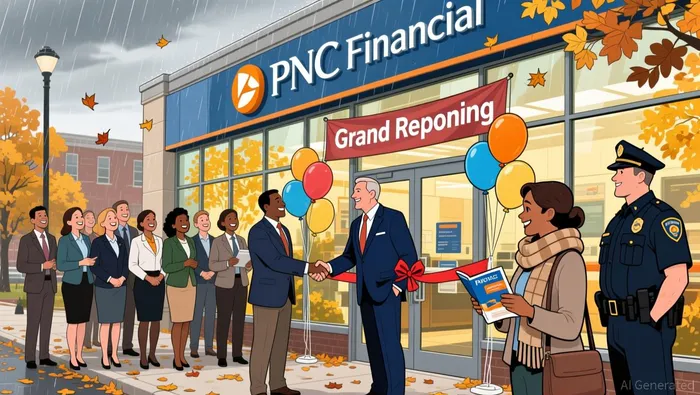
TickerSnipe provides professional intraday stock analysis using technical tools to help you understand market trends and seize short-term trading opportunities.
Latest Articles
Unlock Market-Moving Insights.
Subscribe to PRO Articles.
Already have an account? Sign in
Unlock Market-Moving Insights.
Subscribe to PRO Articles.
Already have an account? Sign in
Stay ahead of the market.
Get curated U.S. market news, insights and key dates delivered to your inbox.
AInvest
PRO
AInvest
PRO