
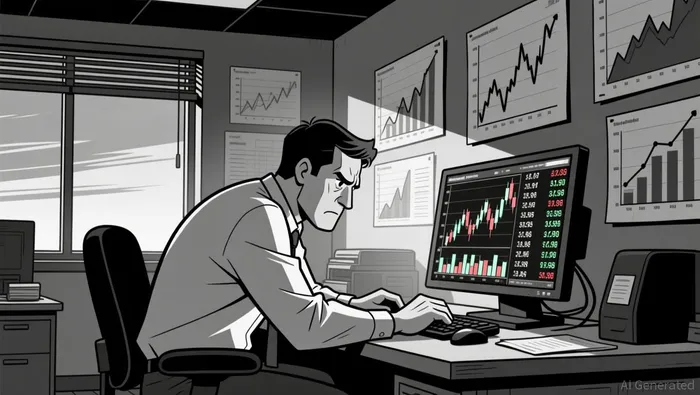
PIVX Slides Below $0.084 as Bearish Momentum Confirmed by Spiking Volume
Generated by AI AgentAinvest Crypto Technical RadarReviewed byThe Newsroom
Tuesday, Apr 7, 2026 12:53 am ET1min read
PIVX-- Aime Summary
At 12:00 ET–1, PIVX/Tether (PIVXUSDT) opened at $0.0874, reached a high of $0.0881, and hit a low of $0.0825 before closing at $0.0832 at 12:00 ET. The pair experienced a total volume of 623,362 PIVX and a notional turnover of approximately $53,197. The move reflects heightened bearish sentiment and elevated volatility.
Price action displayed a sharp, continuous decline over the 24-hour period, forming a bearish continuation pattern. A key bearish engulfing pattern appeared near $0.086, suggesting pressure to continue lower. RSI dropped below 30, indicating oversold conditions, yet momentum remained bearish without signs of reversal, suggesting further downside could be imminent.
Bollinger Bands expanded during the decline, reflecting increased volatility. Notably, volume surged as price dropped through key levels, especially during the 02:00–04:00 ET period, when price fell from $0.084 to $0.0825. This confirms the bearish move rather than signaling divergence.
Price has now approached the 50% Fibonacci retracement level of the recent 5-min bearish swing at $0.0835. Daily support levels appear to be eroding, with the 20-period moving average on the 5-min chart falling below the 50-period line, reinforcing bearish momentum.
PIVXUSDT may testTST-- the next support level at $0.0825–$0.082 in the near term, though a rebound around the $0.0835–$0.084 zone could occur if buyers re-enter. Investors should watch for signs of a reversal or consolidation. A continuation of the downtrend could see further bearish movement, with potential to break below $0.0825. As with all volatile assets, sharp price swings and low liquidity may increase exposure to rapid directional moves.
TST--
Summary
• Price action shows a sharp decline from $0.088 to $0.0825, with a bearish engulfing pattern forming near $0.086.
• RSI dipped into oversold territory below 30, but price continues to trend downward without reversal.
• Volume spiked during the decline, confirming bearish momentum, with turnover rising to $10.8k.
• Bollinger Bands widened during the move, indicating heightened volatility and potential for a reversal or continuation.
• Key support identified at $0.0835 (50% Fib retracement of 5-min drop), now at risk of being tested further.
24-Hour Price and Volume Summary
At 12:00 ET–1, PIVX/Tether (PIVXUSDT) opened at $0.0874, reached a high of $0.0881, and hit a low of $0.0825 before closing at $0.0832 at 12:00 ET. The pair experienced a total volume of 623,362 PIVX and a notional turnover of approximately $53,197. The move reflects heightened bearish sentiment and elevated volatility.
Structure and Momentum
Price action displayed a sharp, continuous decline over the 24-hour period, forming a bearish continuation pattern. A key bearish engulfing pattern appeared near $0.086, suggesting pressure to continue lower. RSI dropped below 30, indicating oversold conditions, yet momentum remained bearish without signs of reversal, suggesting further downside could be imminent.
Volatility and Volume Analysis
Bollinger Bands expanded during the decline, reflecting increased volatility. Notably, volume surged as price dropped through key levels, especially during the 02:00–04:00 ET period, when price fell from $0.084 to $0.0825. This confirms the bearish move rather than signaling divergence.
Key Levels and Fibonacci Analysis
Price has now approached the 50% Fibonacci retracement level of the recent 5-min bearish swing at $0.0835. Daily support levels appear to be eroding, with the 20-period moving average on the 5-min chart falling below the 50-period line, reinforcing bearish momentum.
Forward Outlook and Risk Consideration
PIVXUSDT may testTST-- the next support level at $0.0825–$0.082 in the near term, though a rebound around the $0.0835–$0.084 zone could occur if buyers re-enter. Investors should watch for signs of a reversal or consolidation. A continuation of the downtrend could see further bearish movement, with potential to break below $0.0825. As with all volatile assets, sharp price swings and low liquidity may increase exposure to rapid directional moves.
Decoding market patterns and unlocking profitable trading strategies in the crypto space
Latest Articles
Stay ahead of the market.
Get curated U.S. market news, insights and key dates delivered to your inbox.


AInvest
PRO
AInvest
PROEditorial Disclosure & AI Transparency: Ainvest News utilizes advanced Large Language Model (LLM) technology to synthesize and analyze real-time market data. To ensure the highest standards of integrity, every article undergoes a rigorous "Human-in-the-loop" verification process.
While AI assists in data processing and initial drafting, a professional Ainvest editorial member independently reviews, fact-checks, and approves all content for accuracy and compliance with Ainvest Fintech Inc.’s editorial standards. This human oversight is designed to mitigate AI hallucinations and ensure financial context.
Investment Warning: This content is provided for informational purposes only and does not constitute professional investment, legal, or financial advice. Markets involve inherent risks. Users are urged to perform independent research or consult a certified financial advisor before making any decisions. Ainvest Fintech Inc. disclaims all liability for actions taken based on this information. Found an error?Report an Issue

ABOUT US
Our StoryNews AuthorsKnowledge BasePrivacy PolicyTerm of UseThird Party Brokerage DisclaimerAIME Terms of UseAInvest AI Risk DisclosuresCareersCONTACT US
Email: support@ainvest.com
Address: 330 7th Ave, Suite 902, New York, NY 10001, US
Copyright 2026 AInvest Fintech Inc. All rights reserved.
Comments
No comments yet