

The safest place in the market just got harder to beat. The 10-year U.S. Treasury now yields roughly 4.94%, which means an investor can collect close to 5% a year from a government bond before taking a dollar of equity risk. That quietly redraws the line every dividend stock has to clear. If a stock pays you 6%, the question is no longer "how much." It's "what am I being paid to put up with?" This is the frame that separates real yield from a trap.
Two midstream names make the most useful case. Energy TransferET-- and Enterprise ProductsEPD-- move other companies' oil, gas, and natural gas liquids through pipelines for a fee, and both clear the new risk-free bar. On trailing basis, Energy Transfer yields about 6.25% and Enterprise Products about 5.66%, per Ainvest data. Stacked against the 4.94% Treasury, that's a premium of roughly 1.3 percentage points for Energy Transfer and about 0.7 points for Enterprise Products. Take $10,000 — the pipeline names hand you on the order of $130 and $72 more a year than the bond. Meaningful, but not enormous.
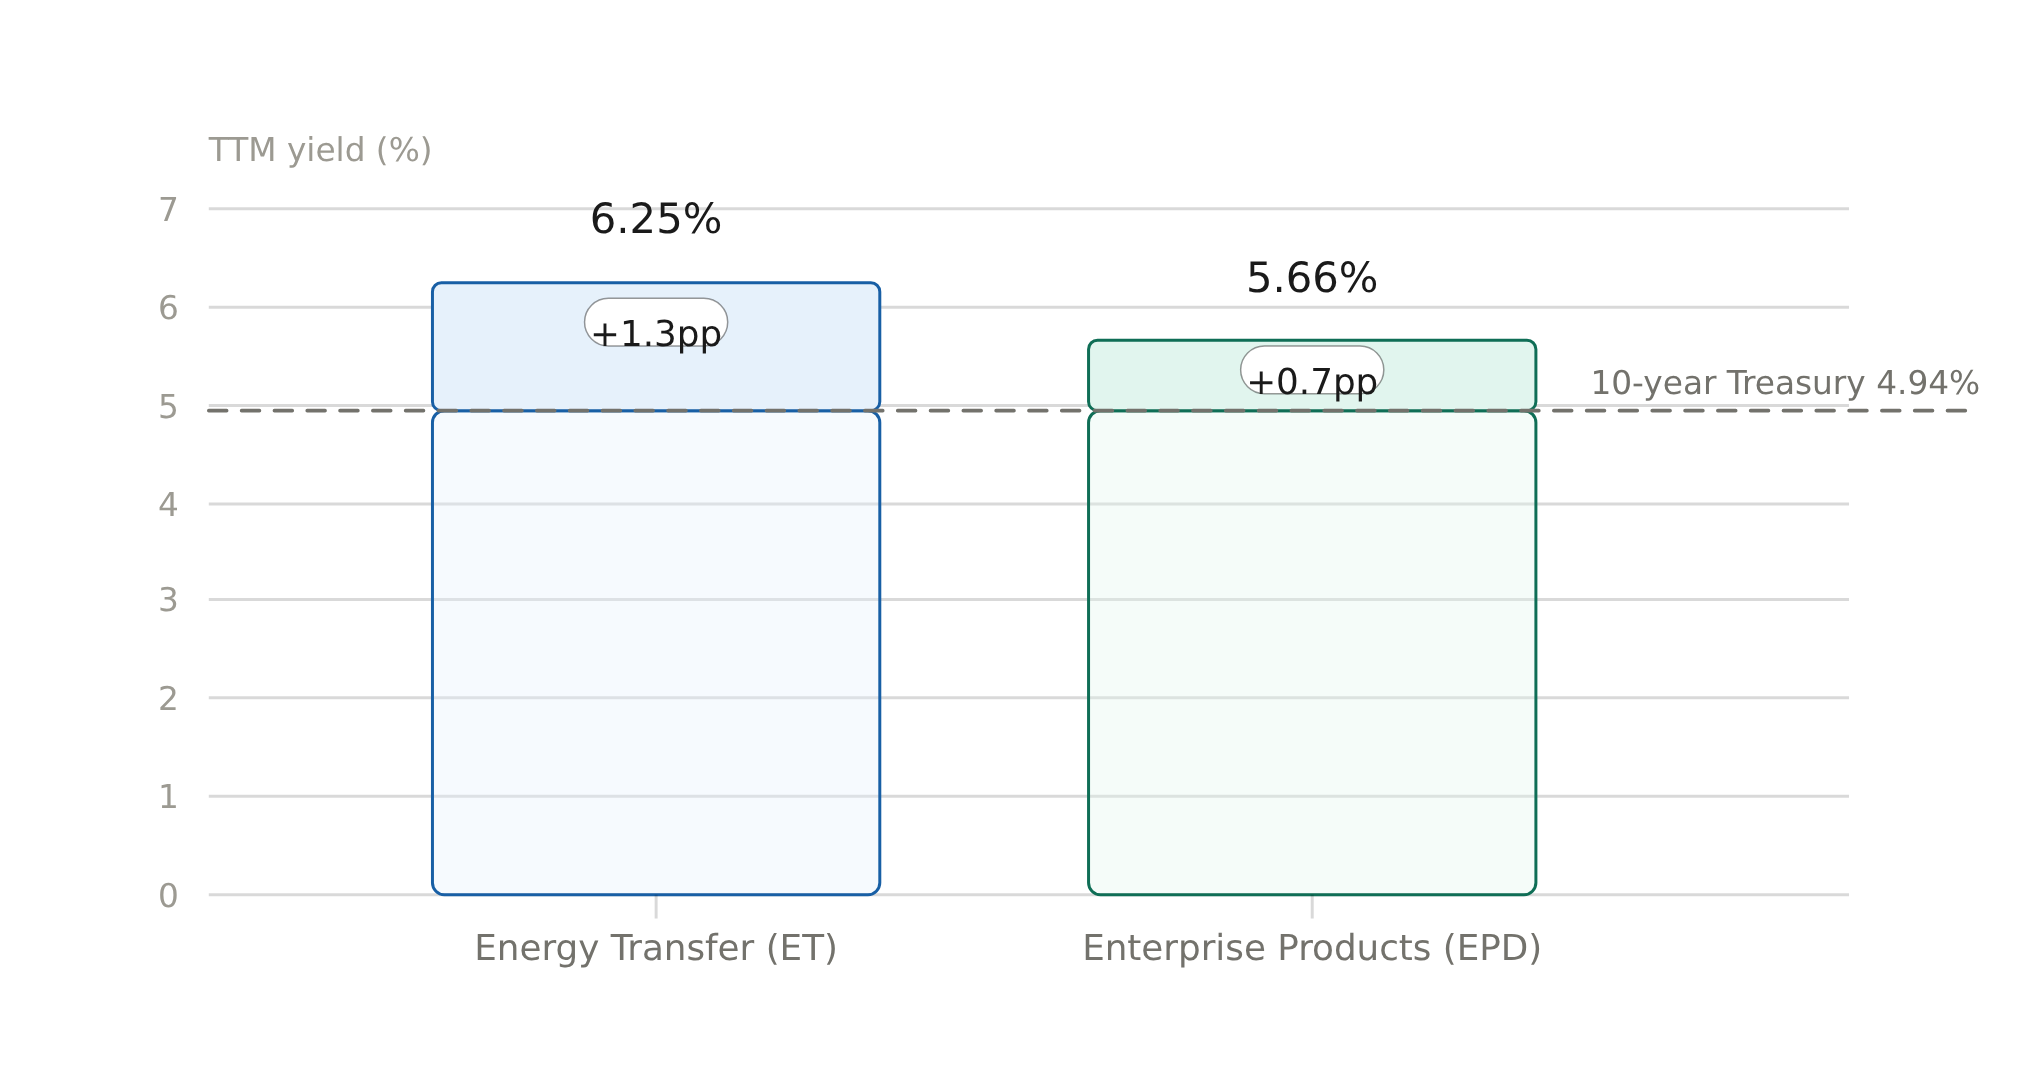
| Instrument | TTM yield (%) | vs 10-year Treasury |
|---|---|---|
| 10-year U.S. Treasury | 4.94 | — |
| Energy Transfer (ET) | 6.25 | +1.3pp |
| Enterprise Products (EPD) | 5.66 | +0.7pp |
So the whole question becomes whether that spread is earned or is simply a risk premium dressed up as yield. A bond pays you 4.94% and never misses; a stock has to beat it while carrying commodity exposure, a single-sector concentration in energy infrastructure, and debt on the books. That is why the answer turns on one number — whether the cash flow actually covers the payout, and whether it is growing.
Energy Transfer's second-quarter disclosure is the load-bearing evidence. The partnership generated $2.59 billion of adjusted distributable cash flow — the cash a pipeline partnership uses to pay its owners — against total distributions of $1.172 billion. Divide the two, 2.59 over 1.172, and you get roughly 2.2 times coverage. The payout was covered more than twice over in a single quarter.
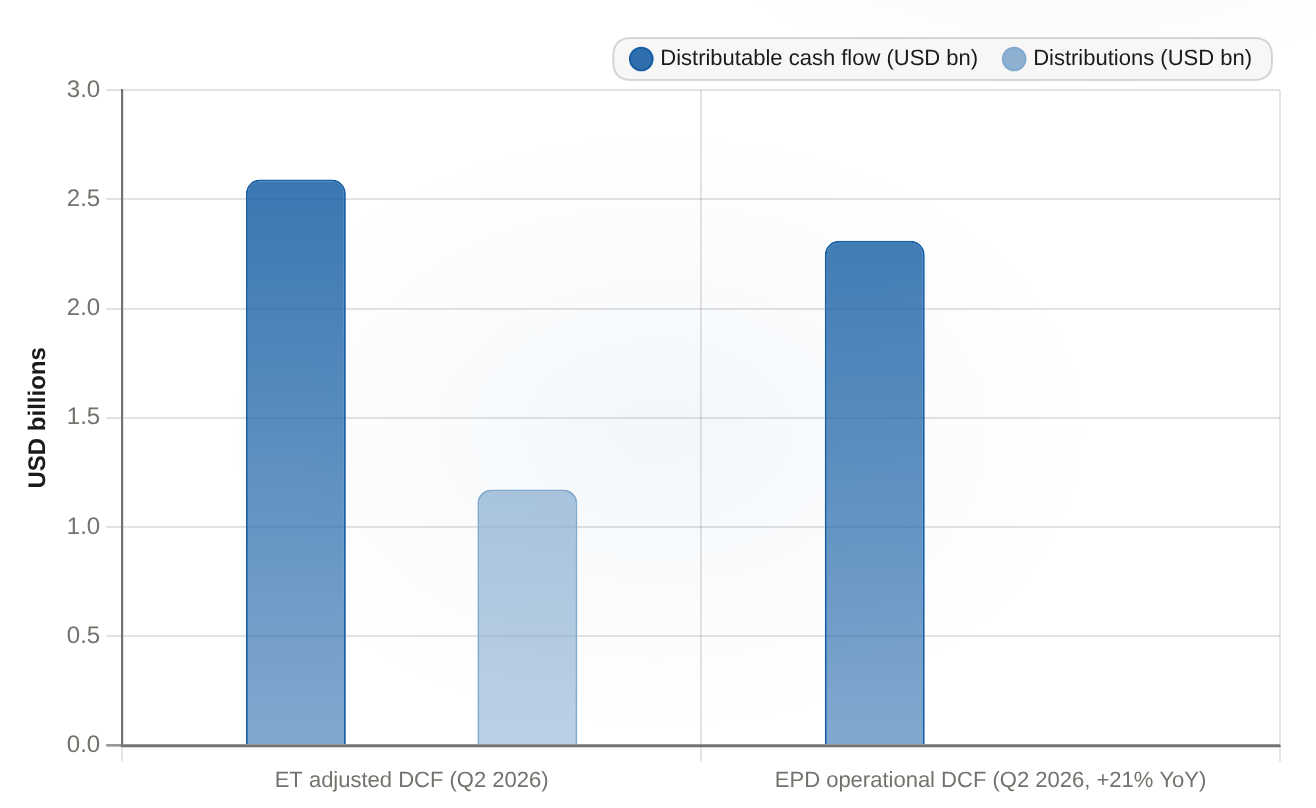
Energy Transfer's Q2 2026 adjusted distributable cash flow of $2.59B covered its $1.172B of distributions by approximately 2.2x.
| Name | Distributable cash flow (USD bn) | Distributions (USD bn) |
|---|---|---|
| ET adjusted DCF (Q2 2026) | 2.59 | 1.172 |
| EPD operational DCF (Q2 2026, +21% YoY) | 2.31 | N/A |
Here's the detail that matters, because it separates a covered stream from a yield quoted high only because the market fears a cut. Energy Transfer raised its quarterly distribution that same quarter, to $0.34 a unit — its nineteenth consecutive increase, more than 3% above a year earlier — and raised full-year guidance as well, lifting 2026 adjusted EBITDA expectations to $18.8 billion to $19.1 billion. A business that over-covers its payout, raises the payout, and raises guidance in the same report is not paying you to tolerate an imminent cut.
Enterprise Products tells the same story from the other angle. It posted a record second quarter, with net income attributable to common unitholders around $1.8 billion, and its operational distributable cash flow rose 21% year over year and covered its distribution. Put the two pipelines together and the logic runs clean: a near-5% risk-free floor has raised the return every equity must beat, these partnerships produce distributable cash flow that is both growing and currently covering their payouts by a wide margin, and so the premium over the Treasury is being earned from cash flow rather than extracted from an uncovered, cut-prone stream.

None of this makes the payout riskless, and I want to be honest about that. The ~2.2x coverage is a single quarter's figure, not a ten-year promise. Measure the payout on a different, more conventional basis and the margin looks thinner: trailing payout ratios run near 85% for Energy Transfer and 80% for Enterprise Products against reported earnings, per Ainvest data, so how comfortable you are depends entirely on which measure you trust. Both also carry real debt — Energy Transfer around $67.4 billion of net debt at a debt-to-equity ratio near 1.35, Enterprise Products around $33 billion at about 1.07. These are levered, energy-infrastructure businesses concentrated in one sector. The premium is currently funded; it is not bulletproof.
The useful takeaway is a better way to read any above-Treasury yield. When a stock clears the risk-free rate by a margin, the deciding question is whether that margin is covered and growing, or is simply the market quoting you a price high because it suspects the payout will break. For these two pipelines today, the disclosed cash flow answers the first way. That's a reason to keep watching the coverage quarter after quarter — if distributable cash flow stops covering the distribution by a wide margin across successive quarters, the spread stops being earned and starts being compensation for risk. Treat the edge as currently real, not as a guarantee.








Comments
No comments yet