
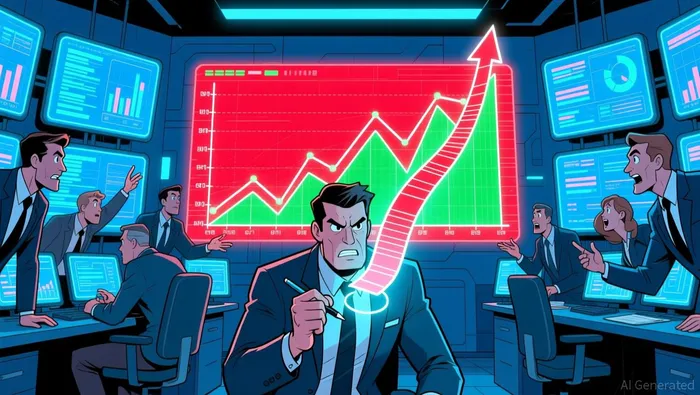
PEPE Faces Mixed Technical Signals and Volatility Amid Meme Coin Rally
PEPE has surged in price, reaching a $2.7B valuation and testing a key resistance zone. Technical indicators such as RSI and MACD show mixed signals, with RSI at 59.77 and MACD indicating bearish momentum. Analysts project a potential price target range of $0.0000065 to $0.00000690, with 30-45% upside potential if bullish conditions continue according to analysis.
PEPE, a memeMEME-- coin, has gained significant traction in the past week, contributing to a $11 billion increase in the overall market capitalization of meme coins. The coin's price has surged by 60%, reaching a valuation of $2.7B, and is currently testing a key resistance zone. This has led to growing interest from both retail and institutional investors, albeit amid a backdrop of high volatility and speculative trading.
Analysts and traders are closely watching the technical indicators for PEPEPEPE--. The RSI is currently at 59.77, indicating neutral territory, while the MACD histogram suggests bearish momentum. The coin is near the upper Bollinger Band at 0.6727, a position historically linked to either breakout attempts or pullbacks. These mixed signals suggest that while the price could break above the key resistance zone, a consolidation phase or correction is also a possibility.
The broader market dynamics for meme coins are also shifting, with a growing emphasis on utility-driven projects alongside hype-based ones. Institutional interest is rising, though the speculative nature of the sector remains a key concern for risk-conscious investors. Whale activity, such as large holders selling 2.8 trillion tokens (~$20 million), also introduces additional uncertainty for market participants.
What Is the Current Market Structure for PEPE?
PEPE is currently in a consolidation phase, with the RSI at 59.77 and MACD in bearish territory. This has led analysts to project a potential 30-45% rally to the $0.0000065–$0.00000690 range, but also highlights the risk of near-term corrections according to market analysis. The Bollinger Band position at 0.6727 indicates that the coin is near the upper band, suggesting either a breakout attempt or a pullback. The Stochastic oscillator also supports a consolidation thesis.
The market structure for PEPE reflects a tug-of-war between bullish consolidation and bearish resistance. Whale activity, volume trends, and social media sentiment such as Reddit discussions are all influencing the coin's short-term direction. Analysts have identified $0.0000065 as a critical level to watch, especially for potential bullish breakouts and risk management strategies.
What Technical Indicators Suggest for PEPE's Price Movement?
The technical indicators for PEPE suggest a mixed outlook. The RSI is at 59.77, indicating neutral momentum, while the MACD histogram is bearish. These signals suggest the coin is in a transitional phase and could either continue its bullish trend or consolidate into a new range. The Bollinger Band positioning at 0.6727 adds to this uncertainty, as it historically precedes either breakouts or pullbacks.
Traders and investors are advised to monitor key levels closely, including $0.00000500, $0.0000065, and $0.00000690 according to technical analysis. A clean pullback to the $0.00000500 zone could strengthen the bullish setup if followed by a bounce as market data shows. A breakdown below $0.00000500 could lead to a test of support at the mid-$0.000004 range, potentially signaling a more bearish outcome.
What Are the Key Levels and Strategic Entry Points for PEPE?
Analysts have identified the $0.0000065–$0.00000690 range as a strategic target zone. This range represents both bullish potential and consolidation risk. Strategic entry points suggest waiting for a clear break above resistance with volume confirmation or a test of lower support levels for better risk-reward ratios according to analysis.
The $0.0000065 level is particularly important for bullish scenarios, as it represents a potential breakout threshold. On the other hand, if PEPE fails to break above this level and retraces, the $0.00000500 zone becomes a key support to watch. A breakdown below this level could trigger further downward movement toward the mid-$0.000004 range, which is seen as another key level by market observers.
The Stochastic oscillator and Bollinger Band positioning are additional tools traders use to gauge momentum and volatility. The Stochastic readings suggest a transitional phase, while the Bollinger Band at 0.6727 indicates potential upside but also limited breakout momentum. This combination reinforces the need for cautious risk management strategies in a highly volatile market.
Blending traditional trading wisdom with cutting-edge cryptocurrency insights.
Latest Articles
Stay ahead of the market.
Get curated U.S. market news, insights and key dates delivered to your inbox.


Comments
No comments yet