
Pathward Financial's 15-Minute Chart Experiences MACD Death Cross and KDJ Death Cross.
ByAinvest
Monday, Mar 17, 2025 2:53 pm ET1min read
CASH--
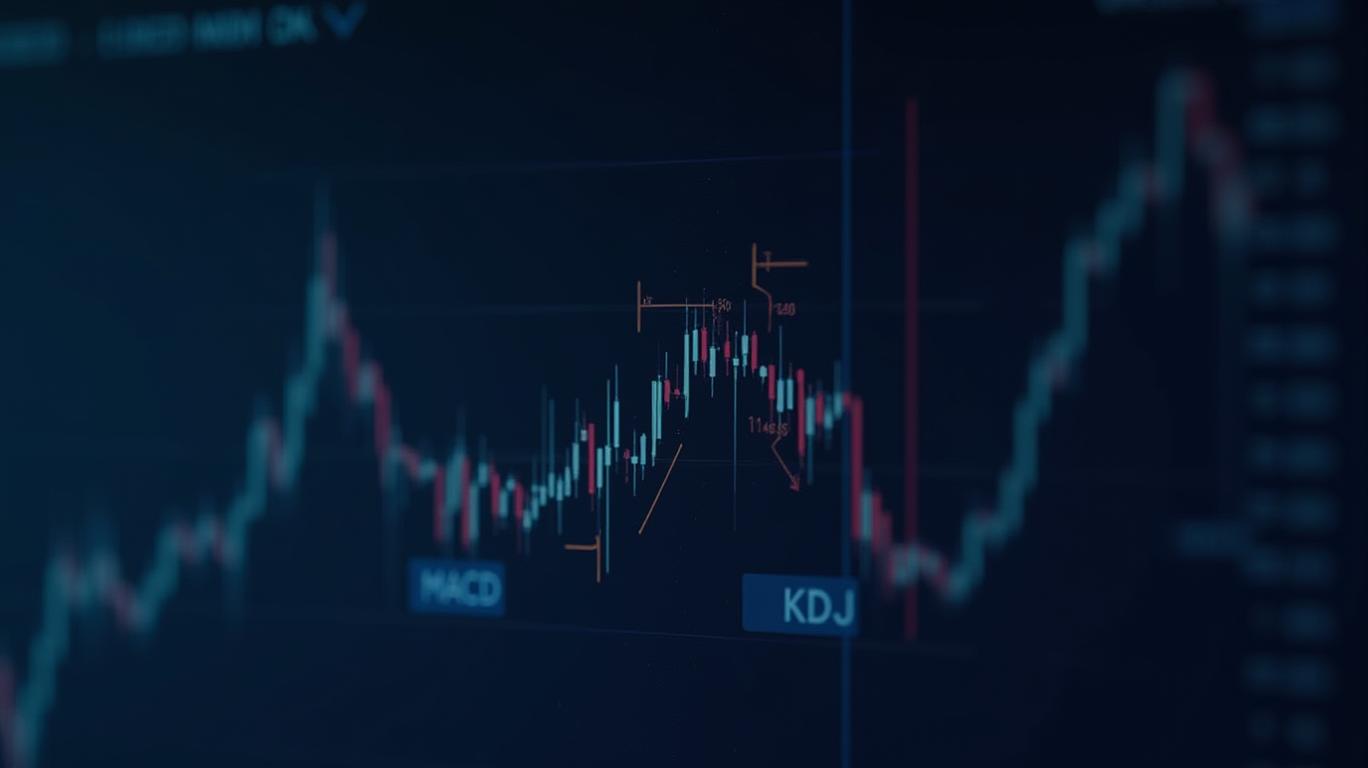
The MACD, a trend-following momentum indicator, signaled a bearish reversal when its shorter-term moving average (12-day exponential moving average) crossed below its longer-term moving average (26-day exponential moving average) [2]. This bearish crossover, also known as a "death cross," occurred at approximately 14:45 on March 17 [1]. This chart pattern indicates that the stock's momentum is shifting towards the downside and that a potential trend reversal may be underway.
Simultaneously, the KDJ indicator, which measures buying and selling pressure, also triggered a "death cross." This occurs when the KDJ's 10-day moving average crosses below its 3-day moving average, suggesting that selling pressure is increasing and that the stock may experience further declines [3]. This bearish signal was confirmed at approximately the same time as the MACD death cross [1].
These technical indicators suggest that the negative sentiment and bearish momentum surrounding PWF may persist, potentially leading to further decreases in the stock price. However, it is essential to note that these signals should not be the sole basis for investment decisions. Technical analysis should be used in conjunction with other forms of analysis, such as fundamental analysis, to make informed investment decisions [3].
References:
[1] Ainvest. (2025). Pathward Financial triggers bearish signals on MACD and KDJ indicators on 15-minute chart. https://www.ainvest.com/news/pathward-financial-macd-kdj-bearish-signal-on-15-minute-chart-25031000c3d63b6b3621241b/
[2] Investopedia. (2023). What Is MACD? https://www.investopedia.com/terms/m/macd.asp
[3] Investopedia. (2023). Keltner Channels. https://www.investopedia.com/terms/k/keltnerchannels.asp
CHRO--
PW--
Based on the analysis of Pathward Financial's 15-minute chart, a technical indicator known as the Moving Average Convergence Divergence (MACD) has triggered a "death cross," and the KDJ indicator has also triggered a "death cross" at 14:45 on March 17, 2025. This suggests that the stock price has the potential to continue declining, and the momentum of the stock price is shifting towards the downside, potentially leading to further decreases in the stock price.
Pathward Financial (PWF), a leading financial services company, experienced a significant shift in its stock price trend on March 17, 2025. According to technical analysis, two widely used indicators, the Moving Average Convergence Divergence (MACD) and the Keltner Channel (KDJ), triggered bearish signals on PWF's 15-minute chart [1].The MACD, a trend-following momentum indicator, signaled a bearish reversal when its shorter-term moving average (12-day exponential moving average) crossed below its longer-term moving average (26-day exponential moving average) [2]. This bearish crossover, also known as a "death cross," occurred at approximately 14:45 on March 17 [1]. This chart pattern indicates that the stock's momentum is shifting towards the downside and that a potential trend reversal may be underway.
Simultaneously, the KDJ indicator, which measures buying and selling pressure, also triggered a "death cross." This occurs when the KDJ's 10-day moving average crosses below its 3-day moving average, suggesting that selling pressure is increasing and that the stock may experience further declines [3]. This bearish signal was confirmed at approximately the same time as the MACD death cross [1].
These technical indicators suggest that the negative sentiment and bearish momentum surrounding PWF may persist, potentially leading to further decreases in the stock price. However, it is essential to note that these signals should not be the sole basis for investment decisions. Technical analysis should be used in conjunction with other forms of analysis, such as fundamental analysis, to make informed investment decisions [3].
References:
[1] Ainvest. (2025). Pathward Financial triggers bearish signals on MACD and KDJ indicators on 15-minute chart. https://www.ainvest.com/news/pathward-financial-macd-kdj-bearish-signal-on-15-minute-chart-25031000c3d63b6b3621241b/
[2] Investopedia. (2023). What Is MACD? https://www.investopedia.com/terms/m/macd.asp
[3] Investopedia. (2023). Keltner Channels. https://www.investopedia.com/terms/k/keltnerchannels.asp
Stay ahead of the market.
Get curated U.S. market news, insights and key dates delivered to your inbox.
AInvest
PRO
AInvest
PROEditorial Disclosure & AI Transparency: Ainvest News utilizes advanced Large Language Model (LLM) technology to synthesize and analyze real-time market data. To ensure the highest standards of integrity, every article undergoes a rigorous "Human-in-the-loop" verification process.
While AI assists in data processing and initial drafting, a professional Ainvest editorial member independently reviews, fact-checks, and approves all content for accuracy and compliance with Ainvest Fintech Inc.’s editorial standards. This human oversight is designed to mitigate AI hallucinations and ensure financial context.
Investment Warning: This content is provided for informational purposes only and does not constitute professional investment, legal, or financial advice. Markets involve inherent risks. Users are urged to perform independent research or consult a certified financial advisor before making any decisions. Ainvest Fintech Inc. disclaims all liability for actions taken based on this information. Found an error?Report an Issue

ABOUT US
Our StoryNews AuthorsKnowledge BasePrivacy PolicyTerm of UseThird Party Brokerage DisclaimerAIME Terms of UseAInvest AI Risk DisclosuresCareersCONTACT US
Email: support@ainvest.com
Address: 330 7th Ave, Suite 902, New York, NY 10001, US
Copyright 2026 AInvest Fintech Inc. All rights reserved.
Comments
No comments yet