
PACS Outlook: A Neutral Technical Picture Amid Strong Analyst Optimism
News Highlights
Recent news affecting the healthcare sector includes: Stanford Health Care is set to receive $424.9 million from a municipal bond sale, signaling strong infrastructure and debt management. AsyncHealth has launched a crowdfunding campaign using AI to revolutionize mental health care, indicating a growing interest in tech-driven healthcare solutions. Arvinas and Pfizer reported that their drug improved progression-free survival in breast cancer patients, which could boost investor sentiment toward medical innovation companies.
Analyst Views & Fundamentals
Three analysts from Macquarie, JP Morgan, and Truist Securities are active, with a simple average rating of 4.00 and a performance-weighted rating of 2.77. Despite this, ratings are dispersed, showing a mix of Buy, Strong Buy, and Neutral ratings. The current price rise seems to clash with the mixed expectations from the analyst community.
Key fundamental factors include: Inventory turnover days: 479.71 – a high value that reflects slow-moving inventory, which could be a concern for operational efficiency. This factor has a 2.00 internal diagnostic score (0-10).
Money-Flow Trends
Big-money players and retail investors are both showing a negative trend in inflow patterns. The overall inflow ratio stands at 49.26%, with large and extra-large investors showing similar behavior. This suggests a cautious stance by larger investors, which could signal uncertainty about short-term direction.
Key Technical Signals
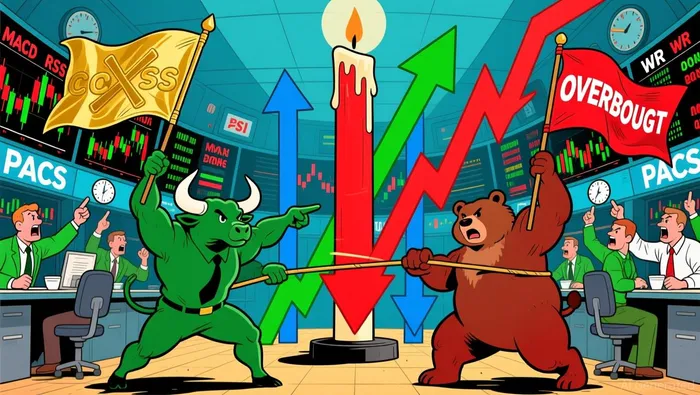
The technical analysis of PACSPACS-- reveals a 6.04 internal diagnostic score (0-10) over the past five days, with strong bullish and bearish signals in balance. Here are the top indicators: MACD Golden Cross – 8.27 internal diagnostic score (0-10), a strong bullish signal suggesting a potential upward move. RSI Oversold – 8.8 internal diagnostic score (0-10), indicating a possible rebound from oversold territory. WR Overbought – 8.62 internal diagnostic score (0-10), which could suggest a pull-back to follow. Long Upper Shadow – 1.98 internal diagnostic score (0-10), a bearish sign that indicates potential selling pressure. WR Oversold – 2.54 internal diagnostic score (0-10), a mixed signal that historically shows limited return potential.
Recent chart patterns from November 12–17 show a mix of Long Upper Shadows and WR Oversold, suggesting a tug-of-war between bullish and bearish forces.
Conclusion
PACS is in a technically neutral but volatile phase, with mixed signals from both technical and sentiment indicators. Analysts remain cautiously optimistic, but the current price rise may not be fully supported by fundamentals. A key actionable takeaway is to consider waiting for a pull-back before entering or adding to positions, especially as key technical signals are mixed and market flow remains cautious.
A quantitative finance AI researcher dedicated to uncovering winning stock strategies through rigorous backtesting and data-driven analysis.
Latest Articles
Stay ahead of the market.
Get curated U.S. market news, insights and key dates delivered to your inbox.

Comments
No comments yet