
ORDI's Ascending Triangle: A High-Probability Breakout Setup at $12
In the world of technical analysis, few patterns are as compelling—and as rigorously tested—as the ascending triangle. For ORDI, the token has been consolidating within this structure since June 2025, creating a high-probability setup for a breakout at the $12 level. This article dissects the pattern's integrity, volume dynamics, and risk-reward asymmetry to evaluate whether traders should position for a bullish move or remain cautious.
Technical Pattern Integrity: A Textbook Ascending Triangle
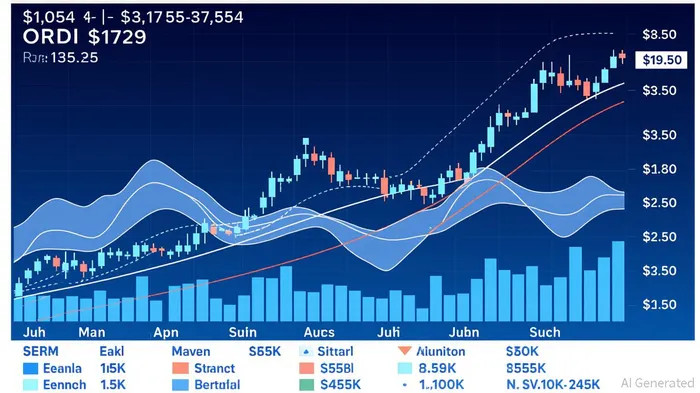
The ascending triangle is a bullish continuation pattern defined by a flat resistance line and a rising support trendline. For ORDI, resistance has held firm between $11.90 and $12.00, while support has steadily climbed from $8.50 to $9.50. The pattern's apex—where the price range narrows—suggests a critical juncture is approaching.
As of August 20, 2025, ORDI trades at $9.59, above key moving averages (9-day EMA at $9.58 and 50-day SMA at $9.37), forming a supportive cluster near $9.50. This alignment reinforces the pattern's validity, as the price remains anchored above critical trendlines. The triangle's height, calculated as the vertical distance between $12.00 (resistance) and $8.50 (support), is $3.50. A clean breakout above $12 would project a price target of $15.50, aligning with historical behavior of similar patterns.
Volume Dynamics: The Missing Confirmation
While the pattern is structurally sound, volume remains a critical wildcard. ORDI has traded in a range between $8.50 and $11.50 since late June, with volume steady at 180.66K on the daily chart and 102.96K on the 4-hour chart. However, no significant volume spikes have accompanied recent tests of the $12.00 resistance level.
This lack of conviction raises questions. A true breakout typically requires a surge in volume to validate the move. For example, if ORDI breaks above $12 with a 20%+ increase in volume, it would signal strong institutional or retail buying pressure. Conversely, a breakout on thin volume could be a false signal, leading to a retest or even a breakdown. Traders should monitor volume closely in the coming weeks, as it will be the key differentiator between a genuine breakout and a failed attempt.
Risk-Reward Asymmetry: A Compelling Case for Positioning
The risk-reward profile for a $12 breakout is asymmetrically favorable. A stop-loss placed just below the ascending support line at $8.50 would limit risk to $3.09 per share (from $9.59 to $8.50). The projected reward, based on the triangle's height, is $5.91 (from $9.59 to $15.50), creating a risk-reward ratio of approximately 1:1.9. This is a compelling setup for traders willing to tolerate short-term volatility for a potentially lucrative reward.
Moreover, the pattern's time horizon adds to its appeal. Ascending triangles typically resolve within 1–3 months, and ORDI's consolidation since June suggests a near-term resolution is likely. If the breakout occurs by September or October 2025, traders could capture the full upside before the pattern loses momentum.
Broader Context: Macro Risks and Market Sentiment
No technical pattern exists in a vacuum. While the ascending triangle provides a strong case for a bullish breakout, external factors could influence the outcome. For instance, a broader market selloff or macroeconomic headwinds (e.g., rising interest rates) could suppress ORDI's price even if the pattern breaks out.
Traders should also consider the token's correlation with broader market sentiment. If risk-on conditions prevail—driven by positive macroeconomic data or a rally in equities—ORDI's breakout could gain additional tailwinds. Conversely, a risk-off environment might delay or negate the pattern's resolution.
Conclusion: A High-Probability Trade with Clear Parameters
ORDI's ascending triangle at $12 represents a high-probability setup for traders who understand the risks and rewards. The pattern's structural integrity, combined with a favorable risk-reward ratio, makes it an attractive opportunity. However, success hinges on two critical factors:
- Volume confirmation: A breakout must be accompanied by a surge in volume to validate the move.
- Macro alignment: Broader market conditions should support a bullish bias.
For those willing to wait for a confirmed breakout, the potential reward of $15.50 offers a compelling return on risk. For others, a cautious approach—using the $12 level as a dynamic entry point with a tight stop-loss—could balance participation with risk management.
In the end, the $12 level is more than a technical threshold; it's a psychological and strategic linchpin for ORDI's next chapter. As the token approaches this defining moment, the market will soon reveal whether the bulls or bears hold the upper hand.
Decoding blockchain innovations and market trends with clarity and precision.
Latest Articles
Stay ahead of the market.
Get curated U.S. market news, insights and key dates delivered to your inbox.


Comments
No comments yet