
Orderly Volume Surges, Yet Price Fails to Hold Gains
 Aime Summary
Summary
- Orderly/Tether exhibits high volatility with a sharp intraday rejection at resistance.
- Volume surged significantly, yet price failed to sustain upward momentum effectively.
- Market structure shows higher highs but faces immediate selling pressure at key levels.
- Candlestick patterns indicate indecision and rejection after the recent bullish surge.
- Traders should monitor support retention to determine the next directional bias.
Market Overview
Orderly/Tether (ORDERUSDT) last traded at 0.03591 with a 24-hour total volume of 11,680,226.4 and turnover reflecting significant liquidity shifts.
1-Hour Support/Resistance and Candlestick Patterns
Price action reveals a clear conflict between buyers and sellers near the 0.03700 to 0.04000 zone. The asset encountered strong resistance at 0.04134 during the 10:00 hour, where a long upper shadow and subsequent bearish engulfing pattern suggest aggressive selling pressure. A second rejection occurred near 0.03888 at 08:00, confirming overhead supply. The current price of 0.03591 sits closer to the immediate support level of 0.03575 than to the recent highs. Candlestick analysis highlights a bearish engulfing pattern at 05:00 and a doji at 07:00, indicating market indecision following the spike. The presence of long upper shadows in multiple candles confirms that bids are being absorbed at higher prices.
Volume and Turnover vs. Historical Comparison
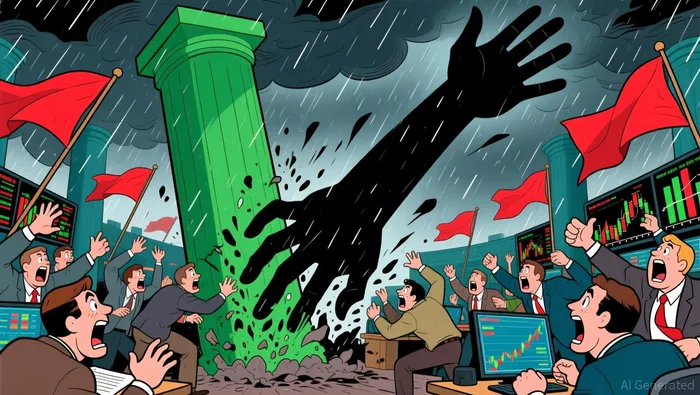
The 24-hour total volume of 11,680,226.4 is substantially higher than the 7-day average daily volume of 2,780,983.39, indicating an anomaly in trading activity. Specific hours such as 04:00, 08:00, 09:00, and 10:00 recorded volumes exceeding 2x the 7-day average single-hour volume of 115,874.31. At 04:00, volume peaked at 2,217,557.8 with a modest 1.69% price gain, showing a lack of follow-through. Similarly, the massive volume spike at 09:00 (1,076,976.2) resulted in a -10.07% price drop, while the 10:00 hour saw 1,309,046.8 volume with a decline. These instances suggest that high volume did not effectively drive sustainable price increases but rather facilitated distribution or panic selling. The volume anomalies appear to have driven price reversals rather than continuations.
Look Back: Current Market Phase
The 7-day price change of 4.91% and the 3-day change of 0.08% suggest a transition in market structure. The 15-day market structure feature is identified as a higher high, indicating a broader uptrend context. However, the recent sharp rejection and high volatility suggest the market may be entering a mean reversion phase or a corrective pullback within the uptrend. The range over the last 15 days is tight at 0.01, which often precedes significant directional moves. Given the recent failure to hold gains above 0.03700, the market appears to be testing lower support levels after a period of accumulation.
The next 24 hours will likely see continued volatility as the market seeks a new equilibrium. If price breaks below 0.03575, further downside risk toward 0.03400 increases. Conversely, a reclaim of 0.03700 with strong volume could signal a resumption of the uptrend.

Decoding market patterns and unlocking profitable trading strategies in the crypto space
Latest Articles
Stay ahead of the market.
Get curated U.S. market news, insights and key dates delivered to your inbox.


AInvest
PRO
AInvest
PRO




Comments
No comments yet