
OPUSDC Breaks Out on Massive Volume, But Sellers Step In
 Aime Summary
Summary
- OPUSDC trades in a tight range near 0.0982 with mixed volume signals.
- A massive volume spike at 11:00 UTC drove a sharp breakout to 0.1018.
- Price action shows rejection at resistance, forming dojis and long upper shadows.
- Market structure remains range-bound despite recent 3-day gains.
- Next 24h likely sees consolidation or pullback if support at 0.0966 fails.
Market Overview Range Breakout Consolidation
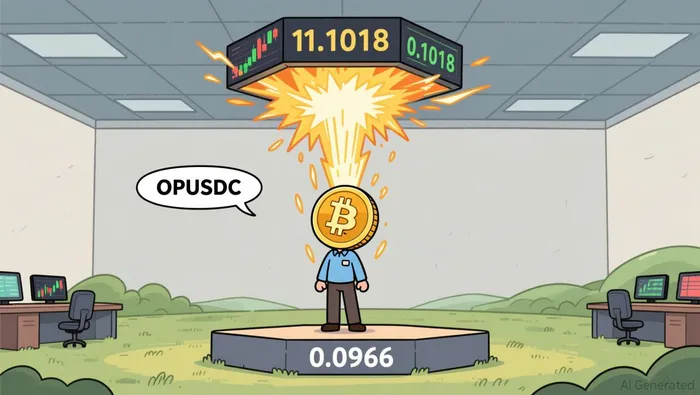
Optimism/USDC (OPUSDC) closed the latest hour at 0.1018, up from 0.0982 in the previous candle. 24-hour total volume surged significantly against historical averages, driven by a spike at 11:00 UTC. The token appears to be testing immediate resistance levels after a volatile session.
1-Hour Support/Resistance and Candlestick Patterns
Price action reveals a clear contest between buyers and sellers around the 0.0982 to 0.1018 zone. The recent high of 0.10181 at 12:00 UTC serves as a key resistance level, marked by the upper wick of the latest candle. Support is identified at 0.09667, where price found a base during the 11:00 UTC candle before rallying. The market structure suggests price is currently closer to resistance, as it tested the upper bound of the recent range. Candlestick patterns indicate hesitation; the 14:00 UTC candle on the previous day showed a doji with a long upper shadow, signaling rejection. Today, the 07:00 UTC candle displayed a doji with a long lower shadow, suggesting buyers are attempting to defend the 0.09477 low, though the body remains small. The 08:00 UTC candle formed a bullish engulfing pattern combined with a long upper shadow, implying that while buying pressure existed, sellers stepped in to cap the move near 0.0967. These patterns suggest that the current upward momentum faces immediate overhead supply.
Volume and Turnover vs. Historical Comparison
The 24-hour trading activity shows a stark deviation from recent norms. The average 1-hour volume over the last 7 days is approximately 23,549. The volume recorded at 11:00 UTC today was 294,013, which is more than twelve times the 7-day hourly average. This massive spike coincided with a price increase from 0.09705 to 0.0982 within that hour, followed by a further rise to 0.10181 in the subsequent hour. However, the following hour at 12:00 UTC saw volume drop to 52,318, yet price continued to climb, indicating strong buying interest with relatively lower participation. Prior to this, volumes were subdued, with the 07:00 and 08:00 UTC candles showing moderate increases to 55,021 and 64,080 respectively, both above the 7-day average. The high volume at 11:00 UTC appears to have effectively driven the price breakout, as there was no immediate reversal or high-volume rejection in the immediate aftermath. The lack of follow-through volume in the 12:00 UTC candle suggests that the initial surge may have exhausted immediate selling pressure, allowing price to drift higher on lighter volume.
Look Back: Current Market Phase
Analyzing the 15-day structure, the market phase is best described as sideways or range-bound. The 15-day daily price range is noted as 0.03, which is relatively narrow compared to the price levels around 0.098, indicating consolidation. While the 3-day price change is positive at 7.11%, the 7-day change is negative at -1.61%, showing a lack of sustained directional momentum over the medium term. The price has been oscillating between key support levels around 0.086 to 0.094 and resistance levels near 0.100 to 0.112. The recent move to 0.1018 tests the upper end of this historical range. There is no evidence of a clear downtrend with lower highs and lows, nor a definitive uptrend with higher highs and lows over the full 15 days. The market appears to be in a mean-reverting or consolidation phase, where price moves within established bounds until a significant volume-driven breakout occurs. The current action suggests a potential breakout attempt, but the broader context remains confined.
Looking ahead 24 hours, OPUSDCOP-- may consolidate near current levels or pull back toward 0.0966 if buying pressure fades. An upside break above 0.1018 could signal a trend shift toward higher resistance zones, while a drop below 0.0966 might expose downside risk toward 0.0947.

Decoding market patterns and unlocking profitable trading strategies in the crypto space
Latest Articles
Stay ahead of the market.
Get curated U.S. market news, insights and key dates delivered to your inbox.


AInvest
PRO
AInvest
PRO




Comments
No comments yet