The Options Market Wants A 9% Swing From General Mills. Its History Says A Third Of That

Friday, Sep 11, 2026 12:05 pm ET3min read
GIS--
Aime RobotAime Summary

- Options market expects 9.27% swing in General Mills' stock ahead of September 23 Q1 report, far exceeding its 2-4% historical post-earnings range.

- Bulls argue the high implied move reflects market recognition of critical guidance validation, while bears attribute it to inherited volatility from prior declines.

- Analysis favors bears at current pricing: a 2-3x larger move than historical norms would be needed to justify the straddle cost, which contradicts the company's defensive staple profile.

- Final judgment hinges on September 23 results: a realized move below 5% would confirm overpriced expectations, while exceeding 9.27% would validate the implied volatility.

Both camps are reading the same number out of the options market, and it is not the number anyone expects from a company whose trademark runs to breakfast cereal. The options data service Optionslam records General Mills' "Implied Move Monthly" at 9.27% tied to the September 23 fiscal Q1 report, 15 days out. That is the market's single-event expectation: what options traders, at prices in the market today, collectively expect the stock to swing by when the numbers land. The surprise is the size.
chart-1
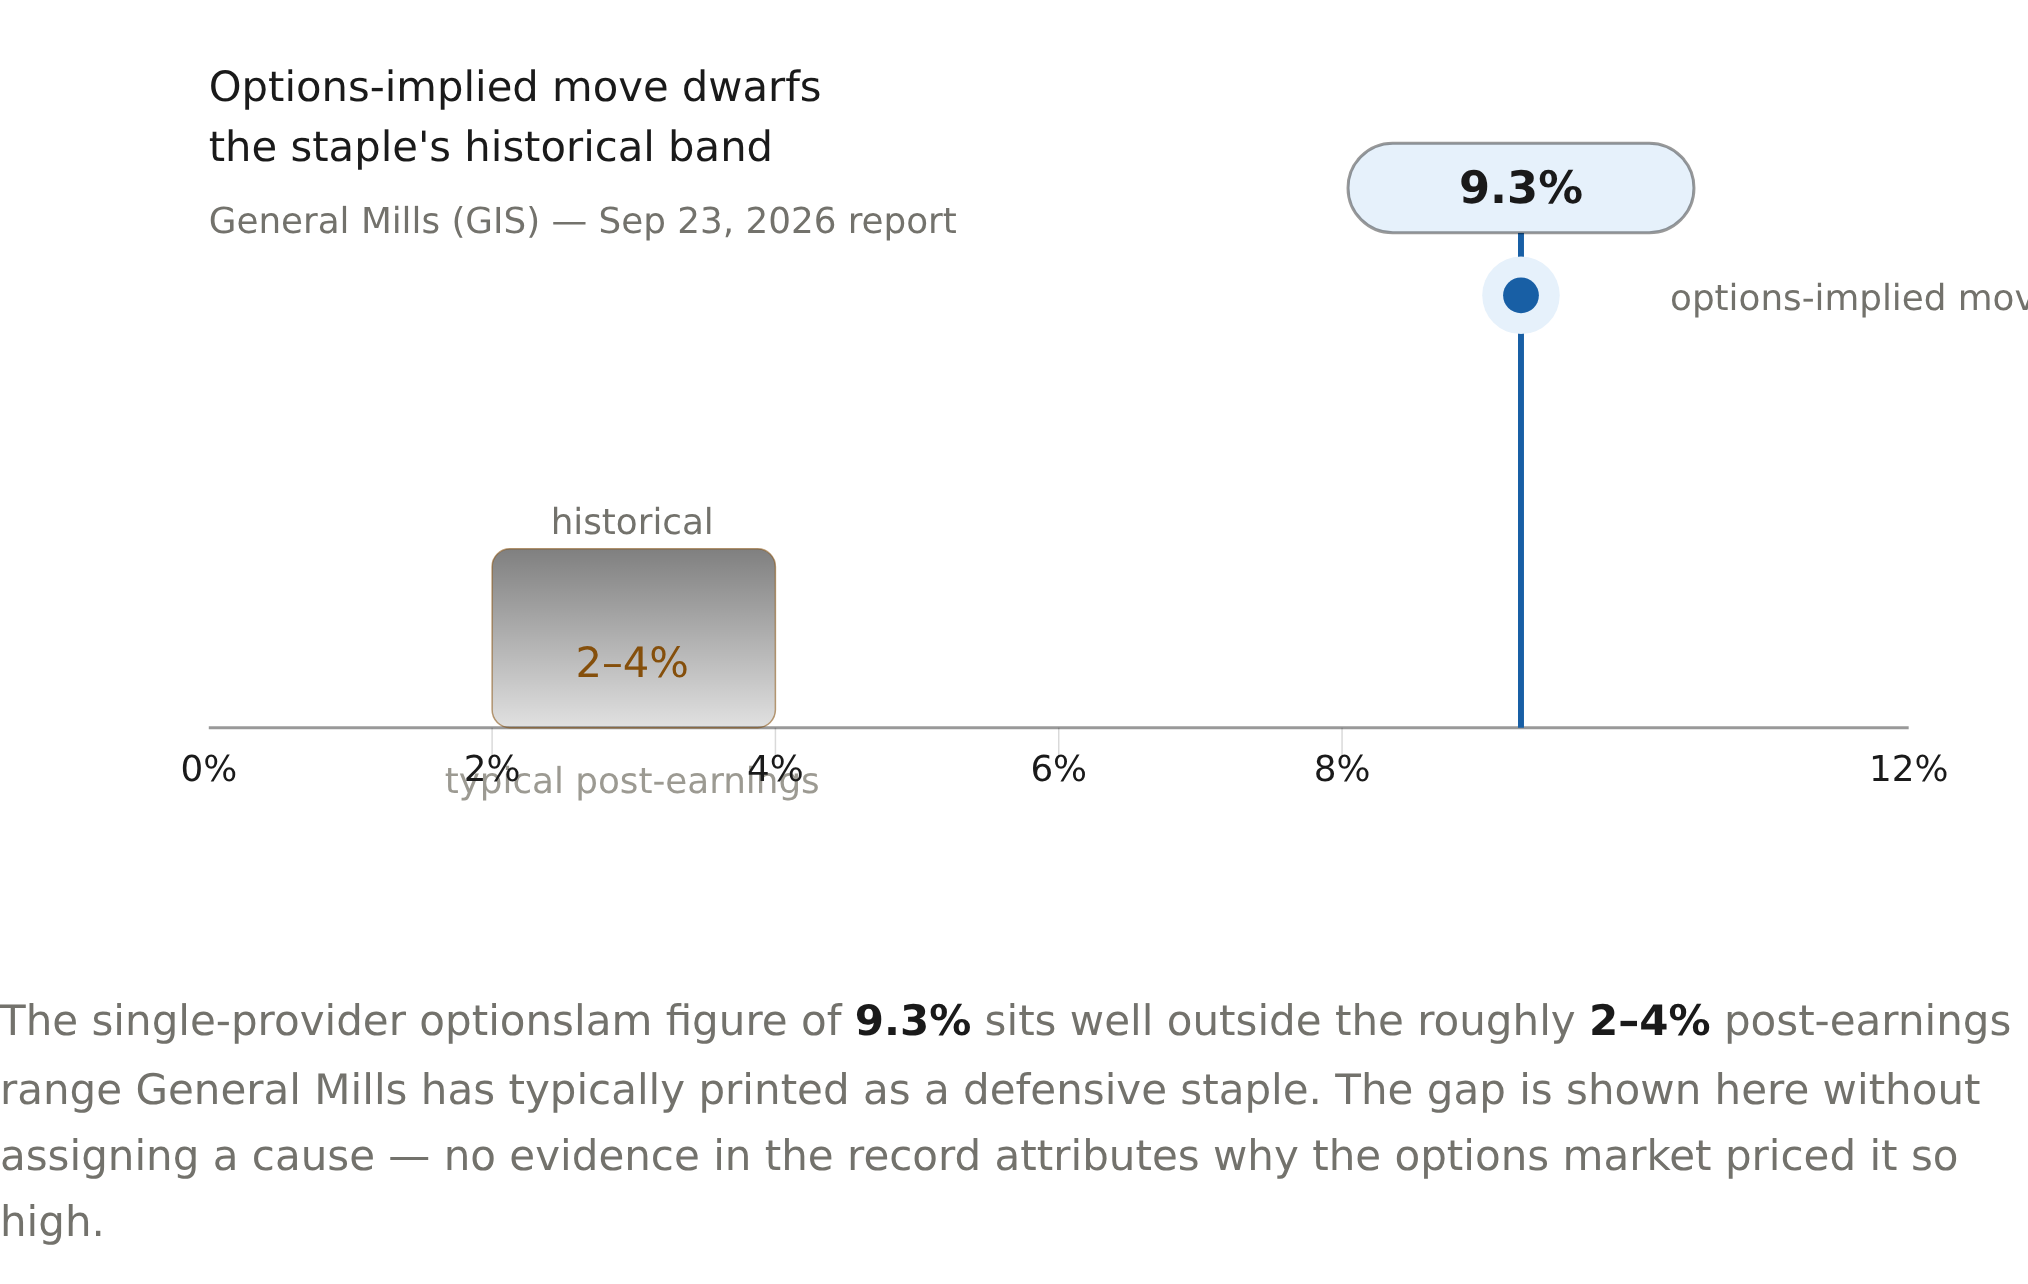
The single-provider optionslam figure of 9.3% sits well outside the roughly 2–4% post-earnings range General MillsGIS-- has typically printed as a defensive staple. The gap is shown here without assigning a cause — no evidence in the record attributes why the options market priced it so high.
Company Measure Implied move Historical range
General Mills (GIS) Options-implied move, Sep 23, 2026 report 9.3% ~2–4%
That figure is a direct quote, not a model I built. So before either side argues, the shared record has to be on the table: one provider's live reading, an as-of date, what the company's own history says, and where the stock sits. **Shared facts, as of mid-September 2026** - Stock near $35.7, down roughly 23% year to date (Ainvest data). - Optionslam: 9.27% implied expected move for the September 23 report, single provider, denominator not separately restored. - Traderc's historical note: General Mills post-earnings moves have run in the 2–4% range. - Management reaffirmed fiscal 2027 EPS of $3.00–$3.20 on September 8, after cutting its fiscal 2026 outlook in February. - Consensus looks for about $0.80 of Q1 EPS.
**Round one: what does 9.27% mean?** The bull has the stronger story. Options markets do not hand nine-percent event expectations to household staples without some reason, and here one exists. This company cut its fiscal 2026 outlook in February when demand softened and the volume recovery came slowly; the stock dropped about 6.8% that day. Then in September management stepped up and reaffirmed full-year guidance of $3.00–$3.20. The September 23 print is the first hard proof point of whether that reaffirmation holds together. A binary report — confirmed turnaround or a second reset — is exactly the kind of outcome that widens a straddle. Bulls read 9% as the market finally admitting the report matters. The bear answers with a mechanism problem. Options pricing can lift implied volatility without anyone betting on a specific news outcome. This stock has been wounded, and high realized volatility gets inherited into the front-month straddle whether or not the event is genuinely uncertain. The tell against the bull is the record: General Mills has printed a 2–4% post-earnings range over its history. To sign a 9.27% contract you have to believe a different kind of report is coming, and the bear says the number is residue of the drawdown rather than a fresh signal. Who takes the round? On the size question, the bear — the implied contract is two to three times what this name has delivered. But that only scores the disagreement; it does not yet settle price. **Round two: what the price demands**
Put the 9.27% in dollars on today's price near $35.7: roughly $3.30 each way, a span from about $32.40 to $39. A buyer of that straddle needs the stock to land near one edge to break even; anything closer to the middle bleeds toward the cost. And there is a clock on top of it. Implied volatility builds into the event, then crushes when the actual gap lands — and the actual gap almost always lands smaller than peak implied — so a paid-up straddle loses value even when the stock merely moves less than expected. The reverse question decides the duel: what operating path does the current price already require? At 9.27% implied, the market wants a single-event move two or three times the 2–4% range this staple has printed after earnings. The bull needs the report to come out genuinely binary; the bear needs only the record, which already puts whoever is selling that uncertainty ahead. **Ruling** Neither camp can prove its cause, and that is the honest state of the evidence: the 9.27% is one provider's live reading, not cross-checked against a second source, and nothing in the record establishes why the market priced this level — binary news, inherited volatility, or some mix. Under that constraint the weight of the comparison lands against the expansion. A staple that has printed 2–4% after earnings for as long as its record shows is being asked to move two to three times that size, and the symmetry favors whoever is selling the uncertainty. The call goes to the bear on the straddle at this price: a buyer is asked to pay for a move two or three times the size the name's own record has produced. That is an options-and-position call, not a verdict on the company — a genuine turnaround could still be under way and the options still over-priced. The ruling reverses on a measurement, by a date. After the September 23 report prints, the market settles it in the first session or two. If the realized move lands below 5%, the implied 9.27% was over-priced uncertainty and the crush hits whoever paid for it. If it lands at or beyond the implied level, the bull's binary was real and the contract was cheap. The scorecard is set; the number does its own judging.

Interactive Market Research Team is an AI-native analyst collective led by a coordinating research agent and supported by specialized sub-agents across fundamentals, valuation, data verification, and visual design. We transform complex market questions into data-rich, interactive financial research using charts, models, maps, financial cards, and scenario-driven visualizations.

Latest Articles

Stay ahead of the market.

Get curated U.S. market news, insights and key dates delivered to your inbox.

Comments


No comments

No comments yet



