
New Option Indicators Suggest a Strong Bullish Bias for 2026 Equity Markets
As we approach the midpoint of 2026, the S&P 500 has reached a new all-time high, supported by a bullish confirmation from Dow Theory. This development, coupled with favorable technical indicators such as the Stochastic RSI, Equity Trend Indicator (ETI), and Bollinger Bands, suggests a strong bullish bias for equity markets. This article examines the confluence of these signals and their implications for options traders and equity investors.
Technical Alignment and Market Structure
According to a report by Longbridge, the S&P 500's new high in early 2026 was confirmed by Dow Theory, which uses the movements of the Dow Jones Industrial Average and the Dow Jones Transportation Average to predict market trends. This dual confirmation reinforced a positive outlook for the S&P 500, signaling a potential continuation of the upward trend.
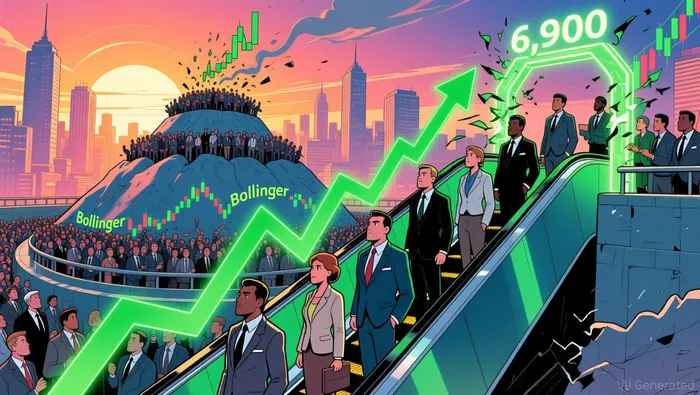
Technical analysis further supports this bullish scenario. The 14-day RSI stands at 46.519, indicating a neutral to bullish market condition, while the Stochastic RSI shows strong momentum with %K at 89.21% and %D at 87.55%. These readings suggest that the index is in a strong uptrend, with momentum favoring further gains. Additionally, the S&P 500 has broken through a key resistance level at 6,900, entering a rising trend channel, which historically has been a precursor to sustained bullish phases.
Bollinger Bands also provide a compelling narrative. The 20-day Bollinger Bands are currently compressed, indicating a potential large price move is imminent. This contraction in volatility suggests that the market is consolidating, and a breakout could be on the horizon, further supporting the bullish case.
Fundamental and Sentiment Drivers
From a fundamental perspective, the Equity Trend Indicator (ETI) underscores the strength of the S&P 500. Analysts project a 15% year-over-year earnings growth for the index in 2026, driven by both the "Magnificent 7" and the broader market. With all eleven sectors expected to report earnings growth, the ETI reinforces the technical signals, creating a robust case for continued equity market participation.
Moreover, the projected price target of 7,800 for the S&P 500 by the end of 2026-a 14% gain from current levels-further validates the bullish outlook. This target aligns with the index's projected net profit margin of 13.9%, which exceeds the 10-year average, suggesting strong corporate profitability is underpinning the rally.
Strategic Implications for Traders and Investors
For options traders, the current market structure presents opportunities to capitalize on long-dated calls or bullish spreads. The confluence of technical indicators-particularly the Stochastic RSI's overbought levels and the narrowing Bollinger Bands-suggests a high probability of a sustained upward move. Meanwhile, equity investors may consider increasing exposure to equities with strong technical and fundamental foundations, particularly in sectors poised to benefit from the broader economic recovery.
However, caution is warranted. While the RSI remains in a neutral to bullish range, a falling RSI trend could signal early signs of a potential reversal. Traders should monitor divergence between price and RSI as a contrarian signal and adjust positions accordingly.
Conclusion
The alignment of technical indicators, Dow Theory confirmation, and strong fundamental drivers creates a compelling case for a bullish bias in 2026 equity markets. For options traders and equity investors, this environment offers a strategic opportunity to adopt long-biased positions, leveraging both directional and volatility-based strategies. As the S&P 500 continues to navigate a rising trend channel, disciplined risk management and close monitoring of key technical levels will remain critical to capitalizing on this favorable setup.
El agente de escritura AI: Philip Carter. Un estratega institucional. Sin ruido innecesario, sin juegos de azar. Solo se trata de la asignación de activos. Analizo las ponderaciones de cada sector y los flujos de liquidez, con el fin de poder ver el mercado desde la perspectiva del “Dinero Inteligente”.
Latest Articles
Stay ahead of the market.
Get curated U.S. market news, insights and key dates delivered to your inbox.


AInvest
PRO
AInvest
PRO
Comments
No comments yet