
Ondo/Rupiah Holds 4248 Support Amid Diverging Volume Signals
Summary
• Price action on ONDOIDR shows consolidation around key support at 4324.
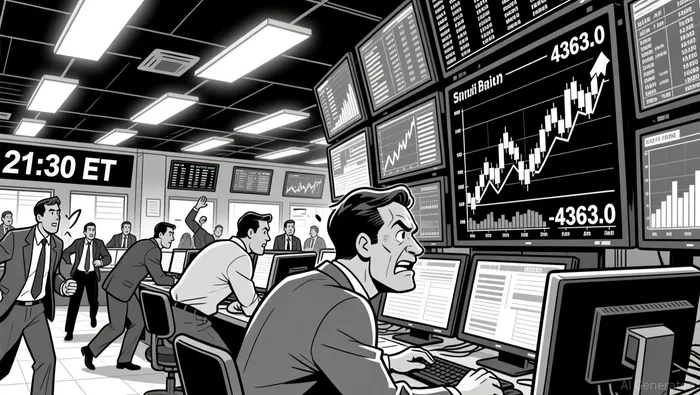
• A large bearish candle at 21:30 ET signals potential reversal after early volume spike.
• Bollinger Bands suggest tightening volatility ahead of a possible breakout.
• RSI remains neutral but may indicate oversold conditions if 4248 level holds.
• Volume and turnover diverge, with heavy volume during price declines but low follow-through.
Market Overview
Ondo/Rupiah (ONDOIDR) opened at 4392.0 on April 4 at 12:00 ET, reached a high of 4392.0, a low of 4248.0, and closed at 4257.0 at 12:00 ET on April 5. Total volume was 6,646.4, with a notional turnover of 43,335,119.3.
Structure & Formations
The pair formed a strong bearish reversal candle at 21:30 ET with an open and close at 4363.0, marking a key resistance breakdown. Later, a 4324.0 support held through much of the night, with a bullish engulfing pattern forming at the close around 4257.0, hinting at a potential short-term bottom.
Moving Averages
On the 5-minute chart, the 20 and 50-period moving averages have been converging near 4350.0, suggesting a neutral bias. Daily moving averages (50/100/200) are still bearish, with the 200 SMA at ~4400.0 acting as a distant overhead barrier.
MACD & RSI
The MACD line has shown bearish momentum after 19:00 ET, with a negative crossover confirming the downward thrust. RSI remains in mid-range territory, suggesting neither overbought nor oversold extremes, though a potential oversold condition may emerge if the 4248.0 level holds.
Bollinger Bands
Bollinger Bands have narrowed after the 4324.0 low, signaling a potential increase in volatility and a breakout scenario. Price appears to be testing the lower band, which may expand if the current range is broken.
Volume & Turnover
Volume spiked sharply at 21:30 ET during the 4363.0 bearish candle, but turnover remained low during the 4248.0 low, indicating limited follow-through. Divergence suggests caution, as buyers have not yet committed to a reversal.
Fibonacci Retracements
Fib levels from the 4392.0 high to 4248.0 low show a key 61.8% retracement at 4317.0, which may become a new resistance. The 38.2% level at 4340.0 appears to have been rejected earlier in the session.
The market appears poised for a directional move, likely upward if 4257.0 holds. However, traders should watch for a potential breakdown below 4248.0, which could trigger a deeper correction. Maintain caution for increased volatility over the next 24 hours.
Decoding market patterns and unlocking profitable trading strategies in the crypto space
Latest Articles
Stay ahead of the market.
Get curated U.S. market news, insights and key dates delivered to your inbox.


AInvest
PRO
AInvest
PRO
Comments
No comments yet