
Ondas Holdings Outlook: Technical Neutrality and Analyst Optimism Collide
Headline takeaway: Ondas HoldingsONDS-- (ONDS.O) is in a period of technical neutrality, but recent analyst actions and positive fundamentals suggest cautious optimism ahead.
News Highlights
U.S. Trump Tariff Policies have continued to shake markets and industries. While this doesn't directly impact ONDSONDS--.O, the uncertainty could affect broader market sentiment, which investors should monitor.
5G Growth Opportunities in enterprise wireless services are being highlighted in research reports. Given ONDS.O’s potential relevance to wireless infrastructure, this trend could offer long-term tailwinds.
Telecom Earnings Reports from companies like Keysight Technologies and TELUS show mixed results. While not directly linked to ONDS.O, these highlight sector volatility and the importance of watching how telecoms perform in a high-interest-rate environment.
Analyst Views & Fundamentals
Analyst Ratings: - Average rating score: 4.50 (simple mean). - Weighted rating score: 4.13 (adjusted for historical performance). - Consistency: Analysts are divided, but the stock has seen recent "Buy" and "Strong Buy" ratings from reputable firms like Needham and Oppenheimer.
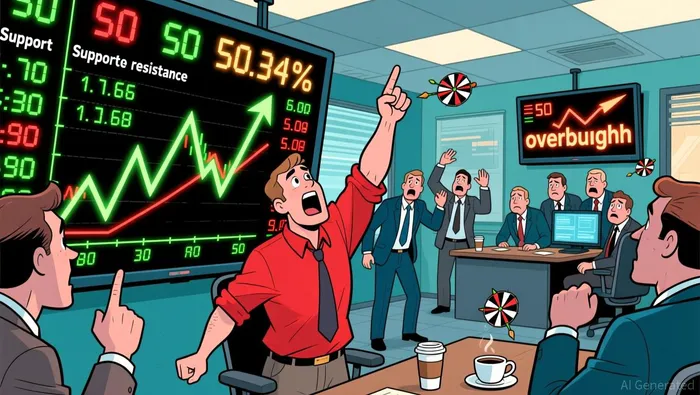
Price Trend vs. Analyst Expectations: The current price is up by 50.34%, and analyst expectations align with that upward movement. This suggests that the market is broadly in agreement with the stock’s direction, albeit with some variance in the strength of recommendations.
Key Fundamental Factors and Internal Diagnostic Scores (0-10): Price-to-Book (PB): Value = 1.48 (148% of book value) | Internal diagnostic score: 1.00 — suggests a slightly overvalued balance sheet. Price-to-Cash Flow (PCF): Value = -31.37 | Internal diagnostic score: 2.00 — mixed signal, indicating possible overvaluation based on cash flow. Gross Profit Margin (GPM): Value = 25.79% | Internal diagnostic score: 3.00 — decent profitability, but room for improvement. Return on Assets (ROA): Value = -0.05 (negative) | Internal diagnostic score: 0.00 — a negative indicator suggesting asset inefficiency. Asset-to-Market Value (Asset-MV): Value = -45.01% | Internal diagnostic score: 2.00 — indicates market capitalization is much higher than asset value, possibly signaling overvaluation.
Money-Flow Trends
The fund-flow analysis shows a negative trend overall, with all major categories—extra-large, large, medium, and small—registering outflows. However, the inflow ratios (ranging from 0.478 to 0.486) suggest that while outflows are occurring, they aren’t extreme. The fund flow score is 7.89 (good), indicating that while there is caution among big investors, the stock remains attractive enough to retain moderate inflow levels.
Big-money vs. retail flows: Institutional investors are cautious, but the inflow ratios show they aren’t entirely withdrawing. Retail investors also remain in the mix, but the overall trend remains negative. The lack of strong inflow should be watched closely, especially if the stock breaks key support levels.
Key Technical Signals
Internal diagnostic score (technical): 5.7 out of 10, indicating technical neutrality. The market appears to be in a wait-and-see mode, as bullish and bearish indicators are relatively balanced. Bearish Engulfing: Internal diagnostic score: 8.33 — a strong bullish pattern suggesting a potential reversal from downward to upward movement. WR Overbought: Internal diagnostic score: 3.13 — neutral bias, but could signal caution as it indicates overbought conditions. Long Upper Shadow: Internal diagnostic score: 3.46 — neutral rise, indicating a potential bearish reversal if not followed up by confirmation.
Recent chart patterns (5-day window): 11/18/2025: WR Overbought and Bullish Engulfing — mixed signals of strength and caution. 11/19/2025: WR Overbought and Long Upper Shadow — again, a bearish caution sign. 11/20/2025: Bearish Engulfing — a strong bullish signal. 11/21/2025: Long Lower Shadow — indicating strong support and bullish sentiment.
Key technical insight: The market is in a volatile and ambiguous state, with short-term signals pulling in different directions. Investors are advised to watch for a clear breakout or breakdown signal before committing to a directional trade.
Conclusion
With mixed technical signals, cautious yet optimistic analyst ratings, and a slightly negative but not extreme money flow trend, Ondas Holdings is in a phase that demands patience and close monitoring.
Actionable takeaway: Investors should consider waiting for a pull-back or a clear breakout signal before entering a position. Given the current technical neutrality and the internal diagnostic score of 5.7, now may not be the best time for aggressive buying but is ideal for setting watchlists and monitoring for key price levels or earnings updates.
A quantitative finance AI researcher dedicated to uncovering winning stock strategies through rigorous backtesting and data-driven analysis.
Latest Articles
Stay ahead of the market.
Get curated U.S. market news, insights and key dates delivered to your inbox.

Comments
No comments yet