
OLOX Plunges 20.9%: A Brutal Correction to 52-Week Lows Amid Sector Turmoil
 Aime Summary
Summary
• Olenox IndustriesOLOX-- (OLOX) crashes 20.9% to close at $3.71, wiping out intraday gains
• The stock hits a new 52-week low of $3.65, signaling a breakdown in support
• Sector peers like Samsung and SK Hynix rise on supply chain hedging news, contrasting with OLOX's decline
• Turnover rate reaches 8.73% as panic selling accelerates into the close
Olenox Industries suffered a devastating session on August 6, 2026, as heavy selling pressure drove shares from an open of $4.95 down to a closing low of $3.65. This sharp decline represents a significant technical failure, breaching key support levels and leaving the stock at its lowest valuation point in over a year. While the broader semiconductor equipment sector shows signs of geopolitical adaptation, OLOXOLOX-- appears isolated, facing a severe liquidity and sentiment crunch that has erased nearly a fifth of its value in a single trading day.
Geopolitical Headwinds and Technical Breakdown Drive OLOX Sell-Off
The precipitous drop in Olenox Industries is not directly tied to specific company-level news, as no corporate announcements were reported today. Instead, the movement reflects a broader risk-off sentiment within the Semiconductor Equipment sector, exacerbated by geopolitical tensions. Major players like Samsung and SK Hynix are actively evaluating Chinese equipment suppliers like AMEC as a hedge against U.S. export controls. This shift suggests a potential long-term reallocation of capital away from traditional Western-centric supply chains, which may disproportionately impact smaller or less diversified equipment makers like OLOX. Investors appear to be pricing in the risk of reduced demand or competitive pressure as global chipmakers diversify their tooling strategies to mitigate regulatory uncertainty.

Sector Divergence: Giants Hedge While Small Caps Bleed
In stark contrast to Olenox Industries' performance, the broader semiconductor equipment landscape is witnessing strategic pivots rather than uniform declines. Samsung Electronics and SK Hynix saw their shares rise 2.5% and 4.9% respectively, as they reported testing equipment from China's AMEC to ensure supply chain resilience. Meanwhile, Nova, an Israeli metrology equipment maker, posted record quarterly revenue of $255 million, driven by sustained AI demand, with its stock climbing 55% over the past year. These sector leaders are benefiting from structural growth and strategic adaptability, whereas OLOX’s 20.9% crash highlights the vulnerability of companies without clear competitive moats or direct exposure to the booming AI hardware cycle.
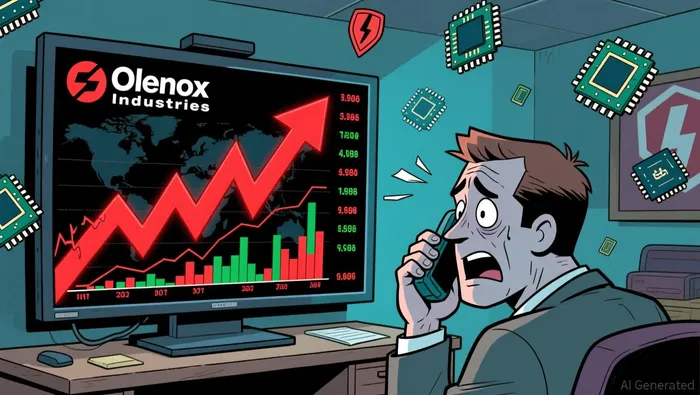
Defensive Positioning: Technical Breakdown Dictates Caution
The technical picture for Olenox Industries is severely bearish, with momentum indicators flashing warning signs of continued downward pressure. Traders should exercise extreme caution as the stock trades well below its moving averages, indicating a strong short-term downtrend.
• 200-day average: Data unavailable (cannot determine long-term trend baseline)
• 100-day average: $3.793 (Price is below, indicating bearish medium-term trend)
• 30-day average: $5.209 (Price is significantly below, indicating strong short-term weakness)
• RSI (14): 39.75 (Approaching oversold territory but still in bearish control)
• MACD: -0.199 (Signal: -0.154, Histogram: -0.045) (Bearish momentum accelerating)
• Bollinger Bands: Lower $4.46, Middle $5.19, Upper $5.92 (Price has shattered the lower band, indicating extreme volatility and breakdown)
With the stock trading at $3.71, it has broken below the 100-day moving average of $3.79 and is far beneath the 30-day average of $5.21. The RSI at 39.75 suggests the stock is nearing oversold conditions but lacks the bullish divergence to confirm a reversal. The MACD histogram is negative and expanding, confirming that selling pressure is intensifying. Given the lack of valid leveraged ETF data and an empty options chain, direct options speculation is not feasible. The focus must remain on technical defense. If the stock fails to hold the $3.65 intraday low, further downside is likely. Aggressive traders might look for a dead-cat bounce near the $3.65 support level for a short-term scalp, but the trend remains firmly downward.
Payoff Calculation Primer: For this payoff estimation, we assume a 5% downside scenario from current price (3.71) where for Call Option Payoff = max(0, ST - K) where ST is projected price and K is strike price and Put Option Payoff = max(0, K - ST) where ST is projected price and K is strike price. This projection helps evaluate option contracts' potential returns under a bearish move scenario.
Due to the absence of an options chain, no specific contracts can be recommended. Traders should wait for liquidity to return before considering derivatives.
If $3.65 breaks, OLOX could see a rapid acceleration toward the next psychological support at $3.00.
Hold Cash: Wait for Stabilization Before Entering OLOX
Olenox Industries is currently in a freefall, with its 20.9% plunge signaling a loss of investor confidence and a breakdown of key technical supports. The move is not isolated but part of a broader sector reshuffle where giants like Samsung and SK Hynix are adapting to geopolitical realities, while leaders like Nova continue to thrive on AI-driven demand. Investors should avoid catching the falling knife; the lack of options liquidity and negative technical indicators suggest further downside risk. Watch for $3.65 breakdown or a stabilization above $4.00 before considering any long positions. Meanwhile, sector leader ASML Holding rose 2.92%, highlighting the strength of established players amidst the volatility.

TickerSnipe provides professional intraday stock analysis using technical tools to help you understand market trends and seize short-term trading opportunities.
Latest Articles
Stay ahead of the market.
Get curated U.S. market news, insights and key dates delivered to your inbox.


AInvest
PRO
AInvest
PRO




Comments
No comments yet