

The oil in the tank is worth more. The bank still wants cash.
That is the awkward part of an oil rally that rarely makes the headline. A company can own the right commodity, protect itself against price swings, and still face a payment it cannot comfortably make.
With Brent settling at $107.63 on September 10 and the European Central Bank announcing another quarter-point rate increase, the collision is worth understanding. Expensive oil increases the money needed to move a cargo. More expensive credit makes that money harder to carry.
The dangerous question is not always whether the trade makes money. It is whether the company gets paid before its next cash call.
A $20 Million Gain That Cannot Pay a $20 Million Bill
Take a simplified example. A merchant owns one million barrels and sells an equivalent amount of futures at $80 a barrel to lock in a selling price. Oil then rises to $100.
The physical barrels gain $20 million in value. The short futures position loses roughly $20 million. If the hedge matches perfectly, those price changes offset economically.
But the futures loss is settled in cash as prices move, potentially within the day. The physical oil may not be sold and paid for until later. That creates a temporary funding gap of roughly $20 million, before other collateral requirements.
The merchant can borrow against the inventory, use cash or draw a credit line. Each solution requires something it has arranged in advance. A higher inventory valuation is not an automatic bank transfer.
This example ignores basis differences, fees and financing costs. Real hedges are messier. But the basic problem survives: locking in a price does not lock in a payment date.
Glencore's Debt Fell. Its Net Funding Rose.
There is a live example of the distinction, not evidence of an impending failure. In Glencore's August results, net debt fell from $11.2 billion to $10.2 billion. Net funding rose from $39.4 billion to $42.4 billion.
Its cash-flow discussion identifies $1.2 billion of net margin-call and derivative-contract settlements within working-capital uses. That is not a standalone trading-loss figure.
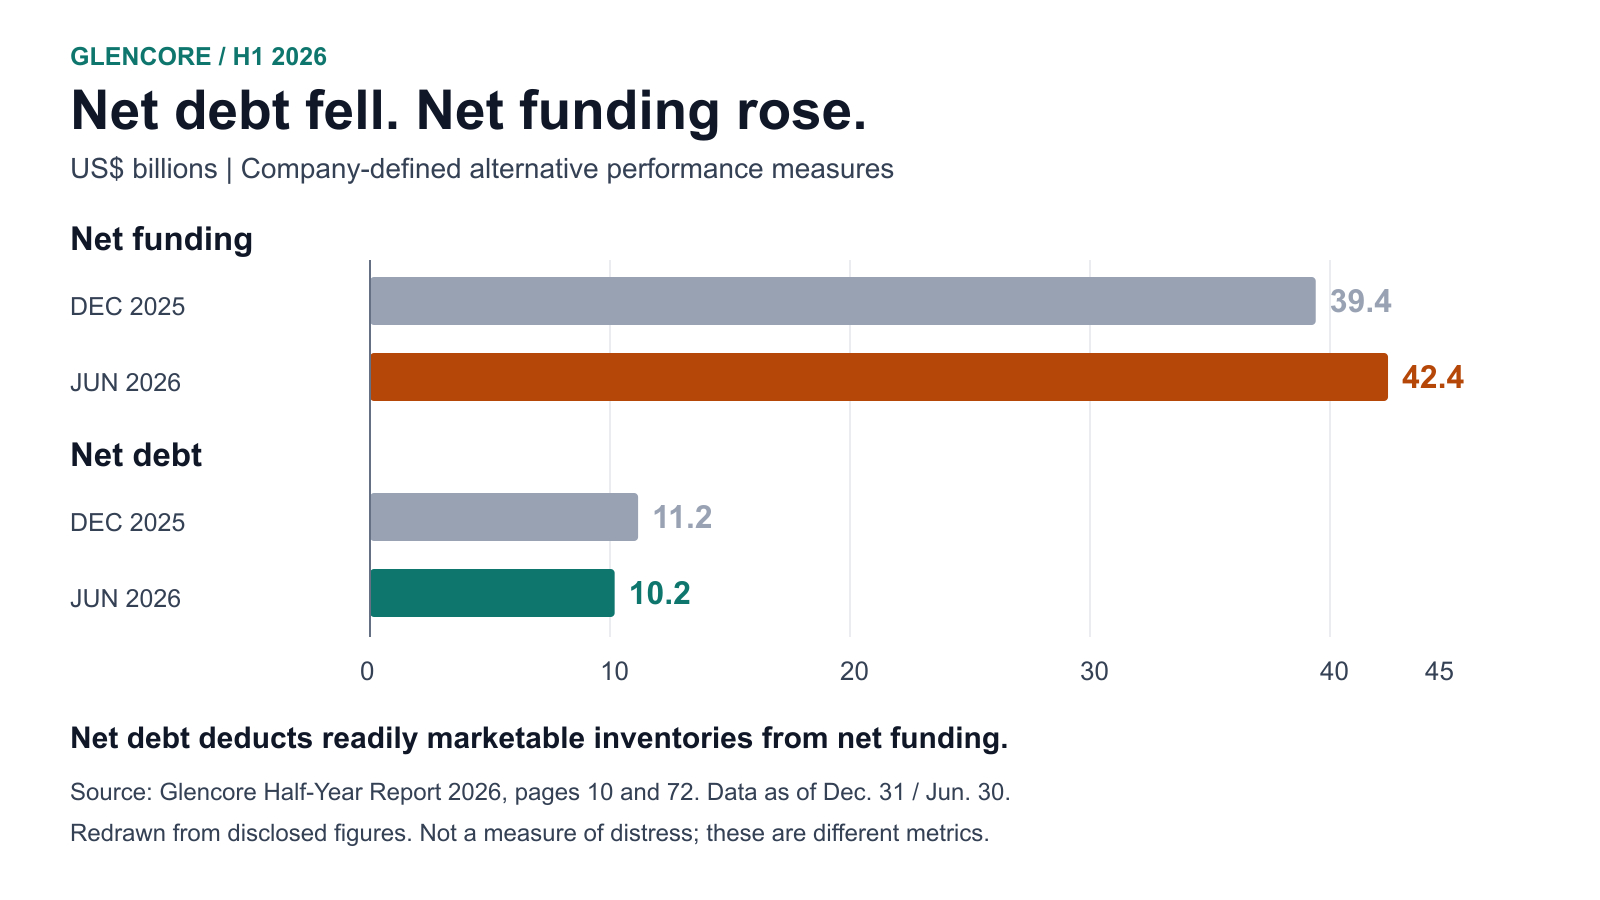
The definitions explain the divergence: Glencore deducts readily marketable inventories when moving from net funding to its net-debt measure. Rising inventory values can therefore coexist with more financing.
Importantly, it also reported $14 billion of available committed liquidity. The investment lesson is to examine that buffer, not to mistake a financing increase for a solvency crisis.
The Interest Bill Is Not the Biggest Bill
A quarter-point increase adds about $12,500 to the cost of borrowing $20 million for three months, using a simple quarter-year calculation. Unwelcome, certainly. But finding the $20 million in the first place is the larger problem.
Price jumps determine the cash call. Volatility can increase collateral requirements. Loan terms determine how much the company can borrow and what it pays. These are related pressures, not the same thing.
Nor does the ECB set the cost of every dollar-funded oil trade. Investors need to check the actual borrowing benchmark, lender spread and collateral terms. A rate headline is a reason to investigate, not a diagnosis.
When Protection Gets Expensive, Some Firms Stop Buying It
The BIS analysis of the 2022 commodity shock found that higher trading costs coincided with fewer commercial participants in U.S. oil futures. Firms with long positions fell from 46 to 33 between February and May; those with short positions fell from 36 to 31.
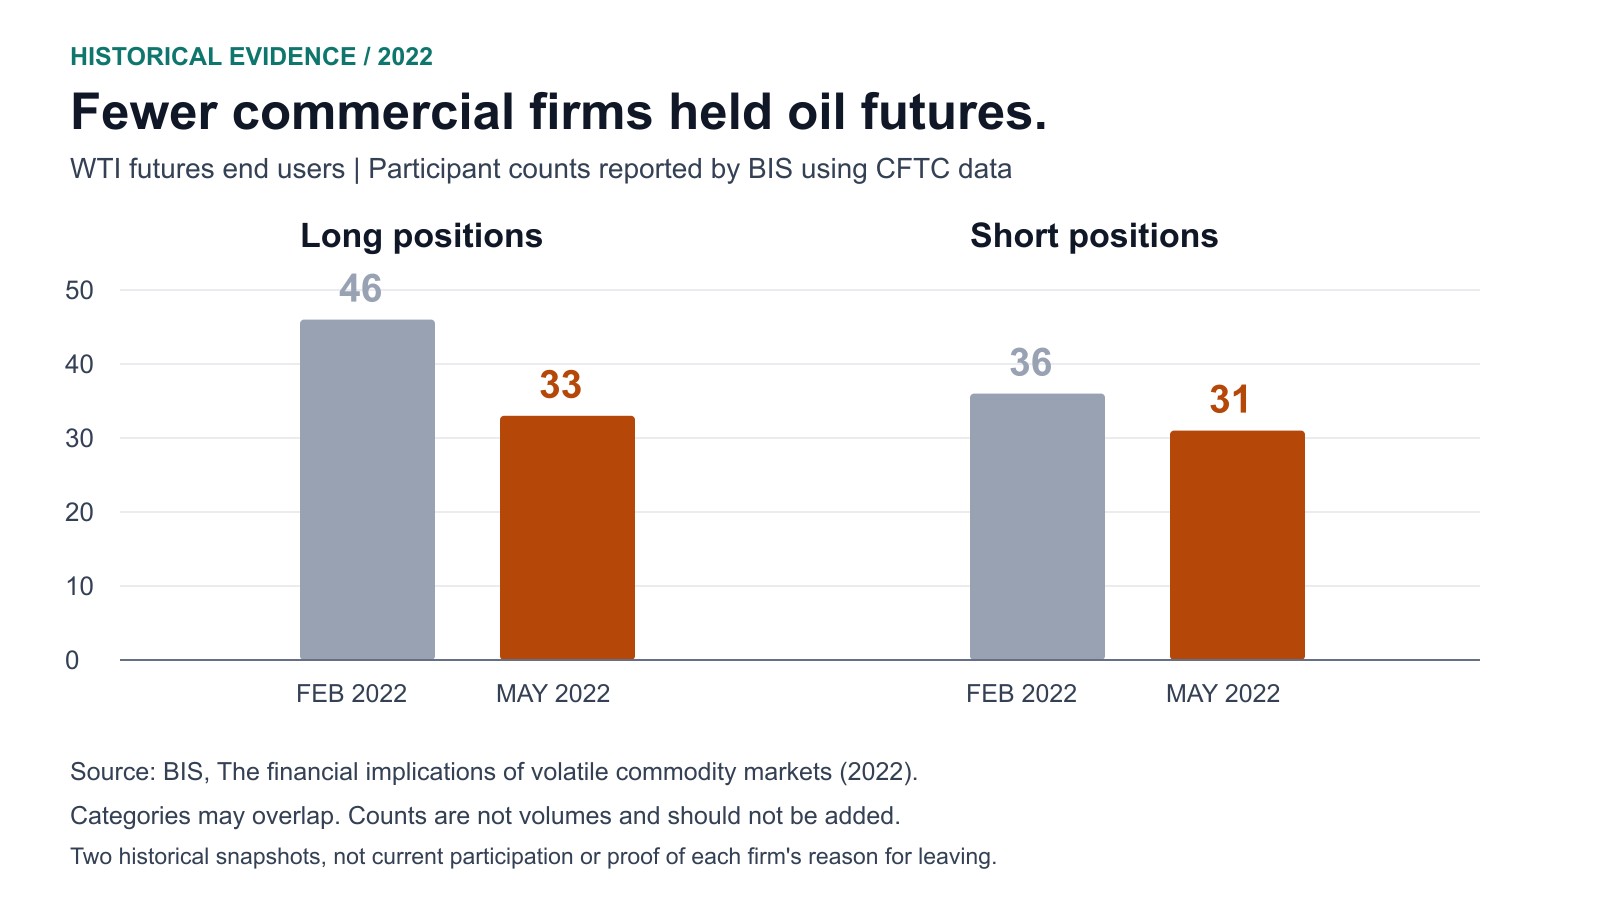
Those counts do not prove why each firm left. But the researchers warned that some end users appeared to be absorbing price risk instead of maintaining their usual hedges.
That is the uncomfortable trade-off: keeping a hedge can consume cash; dropping it can expose the business to the next price swing. Neither choice makes risk disappear.
What to Check Before Buying the Oil Rally
For a listed producer or trader, start with three questions.
How much cash is actually available? Separate unrestricted cash and unused committed facilities from pledged collateral and facilities already drawn. Then compare the usable buffer with near-term debt, working-capital needs and disclosed stress scenarios.
What happens to the hedge when oil rises another $20? Check volumes, instruments and collateral agreements. A short futures position is not equivalent to a purchased put, and not every hedge requires the same daily cash movements. Buying an energy ETF does not remove these differences inside its holdings.
Is the cash drain reversing? A temporary outflow that unwinds when cargoes settle is different from losses, overdue customer payments or a permanently larger funding requirement. The next cash-flow statement matters more than another confident earnings headline.
For Glencore shareholders, this means reading the funding reconciliation alongside earnings. For other energy stocks, it means checking the business model before borrowing the same conclusion. A producer, refiner and merchant do not earn money the same way.
If collateral needs ease, customers pay on time and usable liquidity holds up, the squeeze thesis weakens. Strongly financed firms may even gain business while weaker rivals pull back. None of that establishes a bargain without checking the share price.
Before asking how much an oil company could earn at $120, ask how much cash it would need on the way there.
As of September 11, 2026. The oil settlement and ECB decision are dated September 10; the new ECB rates take effect September 16. The barrel and interest calculations are illustrations, not company exposures or forecasts. Historical participation data are from 2022. No named company is alleged to be unable to meet its obligations. This analysis is not a buy or sell recommendation.








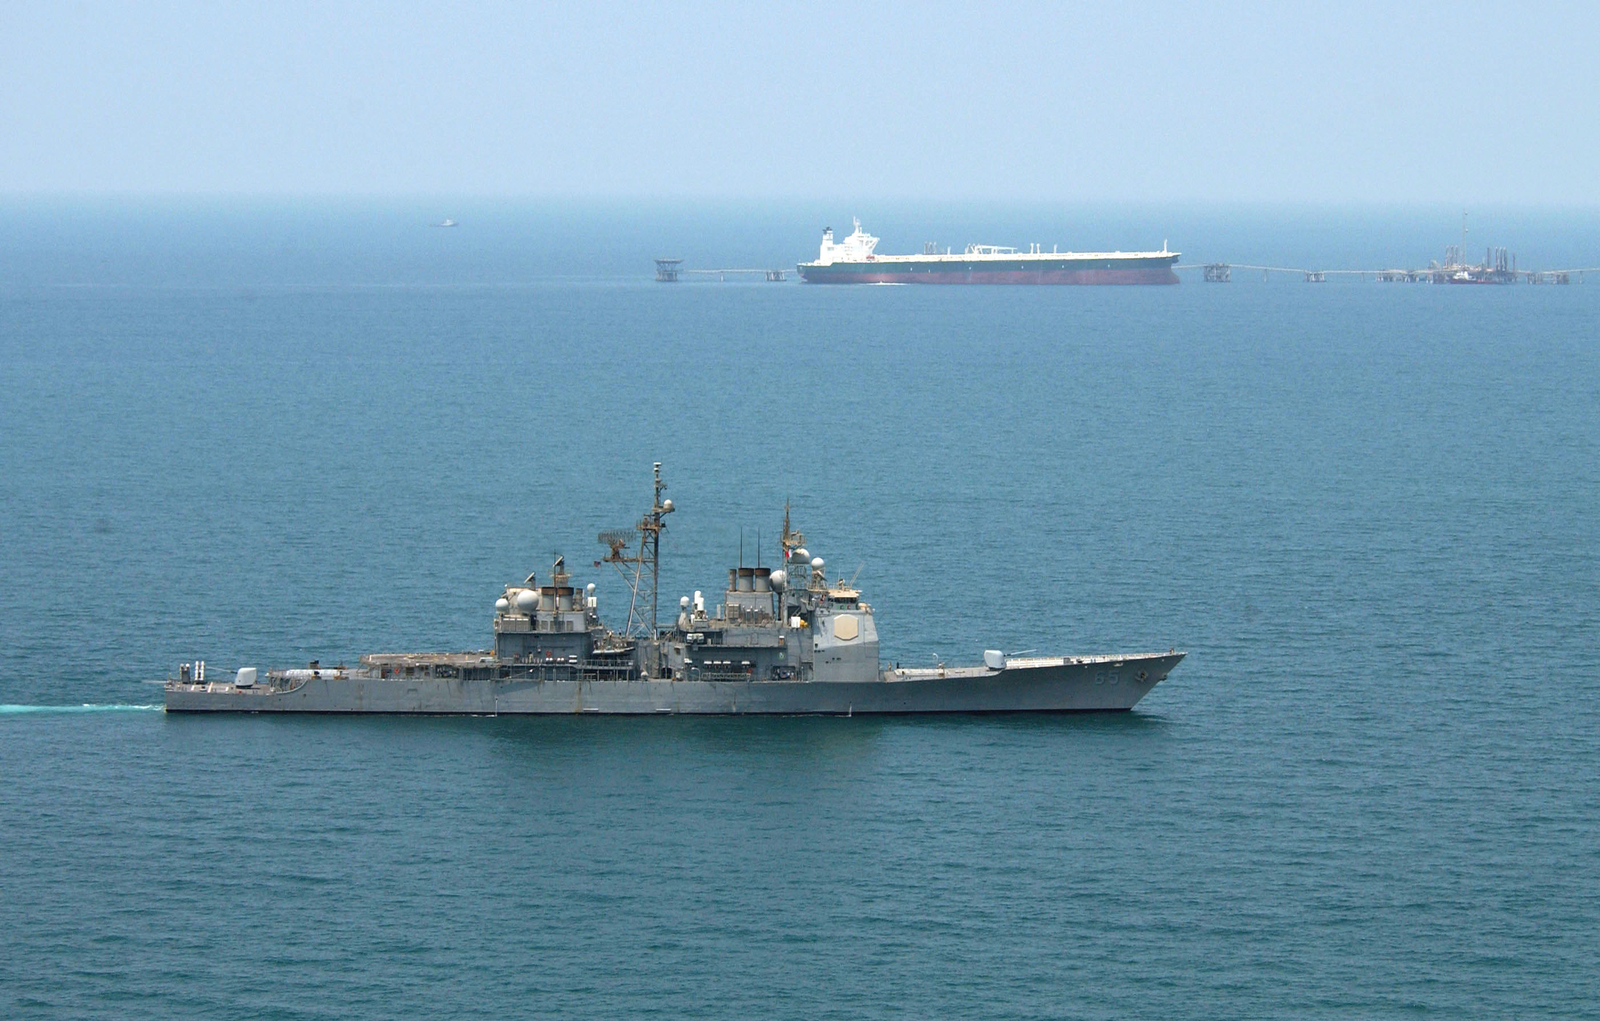
_enforces_an_exclusionary_perimeter_as_commercial_oil_tanker_AbQaiq_readies_itself_to_receive_oil_at_Mina-Al-Bkar_Oil_terminal_(MABOT),_an_off_shore_Iraqi_oil_installation.jpg)
Comments
No comments yet