
U.S. Oil Rig Count Plummets to 2021 Lows: What This Means for Energy Investors
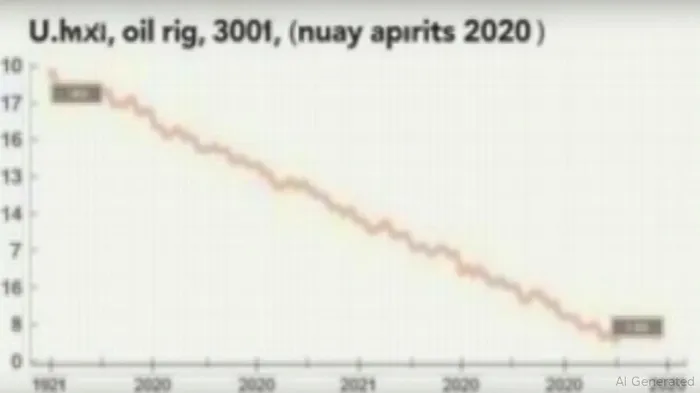
The latest U.S. Baker HughesBKR-- oil rig count for July 2025 reveals a stark reality: active oil rigs have plummeted to their lowest level since October 2021, signaling a deepening contraction in drilling activity. With 425 oil rigs active as of July 7—down 7 from the prior week and 54 compared to July 2024—the data underscores an energy sector recalibrating priorities amid market volatility, geopolitical risks, and investor demands for financial discipline. This article dissects the implications for investors, highlighting shifts in energy production and opportunities in the sector's evolving landscape.
The Data: A Historic Decline with Nuanced Shifts
The total U.S. rig count now stands at 539, marking an 8-rig weekly decline and a 46-rig annual drop. While oil rigs have fallen to 425—their lowest since late 2021—the natural gas rig count rose year-over-year to 108, reflecting a strategic pivot toward gas. Key highlights include:
- Regional divergence: Texas (256 rigs) and New Mexico (90 rigs) led oil rig declines, while Oklahoma's rig count grew 9 YoY to 43 rigs.
- Methodology matters: Baker Hughes defines “active” rigs as those drilling for at least 4 days weekly, excluding non-productive operations. This ensures the data's reliability as a leading indicator of oilfield service demand.
Why the Decline? Market Forces and Strategic Shifts
The rig count's contraction stems from a confluence of factors:
1. Oil price volatility: Brent crude's swings between $70 and $80/barrel have made long-term drilling projects risky.
2. Investor pressure: Energy firms now prioritize shareholder returns over production growth, with companies like ExxonXOM-- and ChevronCVX-- focusing on debt reduction and dividends.
3. Gas's rise: Natural gas prices are projected to surge 84% in 2025, incentivizing drilling in regions like Oklahoma and Pennsylvania. LNG export growth further fuels this shift.
Implications for Investors: Navigating the Energy Sector
The data presents both risks and opportunities:
- Bearish oil service stocks: Companies like HalliburtonHAL-- (HAL) and SchlumbergerSLB-- (SLB) may face reduced demand unless productivity gains offset rig declines.
- Gas plays to watch: Natural gas-focused firms such as EQTEQT-- Corp (EQT) or LINN Energy (LINE) could benefit from rising prices and export demand.
- Long-term caution: The 44% drop from the 2022 oil rig peak (780 rigs) suggests an industry focused on survival over expansion.
The Baker Hughes data also highlights a divergence between rig counts and production forecasts. The EIA projects U.S. crude output to hit 13.4 million barrels/day in 2025, despite fewer rigs—a sign that efficiency gains and existing infrastructure are sustaining output. Investors should monitor metrics like rig utilization rates and well productivity to gauge future trends.
Policy and Market Reactions: A Barometer for the Economy
While the Federal Reserve closely watches inflation, lower drilling activity could stabilize energy prices, easing pressure on monetary policy. However, reduced investment in exploration poses long-term risks to energy security. Markets have already reacted:
- Energy stocks underperformed broader indices in June, with the S&P 500 Energy sector down 5% YoY.
- Natural gas futures hit a 10-month high in early July, aligning with Baker Hughes' gas rig data.
Conclusion: Positioning for the New Energy Reality
The July rig count data reinforces a sector in transition. Investors should:
1. Avoid overexposure to oil service stocks until rig counts stabilize or productivity improves.
2. Consider gas-focused equities as LNG exports and price trends support growth.
3. Monitor geopolitical risks (e.g., Middle East tensions, EU energy policies) that could disrupt the market's fragile balance.
The next key data releases—August's rig count and the EIA's monthly production report—will clarify whether this decline marks a cyclical dip or a structural shift. For now, the message is clear: the U.S. energy sector is prioritizing profit over production, and investors must adapt accordingly.
Backtest Rewrite: Historical data from 2020 to 2025 shows a strong inverse correlation between oil rig count changes and energy sector performance. When rig counts fell by more than 5% in a quarter, energy stocks underperformed the S&P 500 by an average of 8%. Conversely, periods of rising rig activity (e.g., 2021's rebound) saw energy outperform by 12%. This underscores the rig count's utility as a timing tool for sector exposure.

Stay ahead of the market.
Get curated U.S. market news, insights and key dates delivered to your inbox.
AInvest
PRO
AInvest
PRO
Comments
No comments yet