

Oil is the most watched number in any war, and by that test this war has behaved strangely. The Strait of Hormuz, a waterway that carried about 38% of global seaborne crude before the conflict, has been effectively closed since early March, with traffic down roughly 95%, from more than 100 vessels a day to about five. Yet Brent, the global benchmark, trades near $90 a barrel — with a price above $130 reported at the April peak. The road from there to here has been anything but calm: Brent bottomed at $69 on July 2, right after a US–Iran interim deal, jumped to $105 on July 23 after renewed tanker attacks, then settled back near $90 in late August. The mainstream read is that the world simply absorbed the shock, and that $90 is close to a new equilibrium. Before you build a thesis on that number, ask what the market actually put between a closed Persian Gulf and a $90 price.
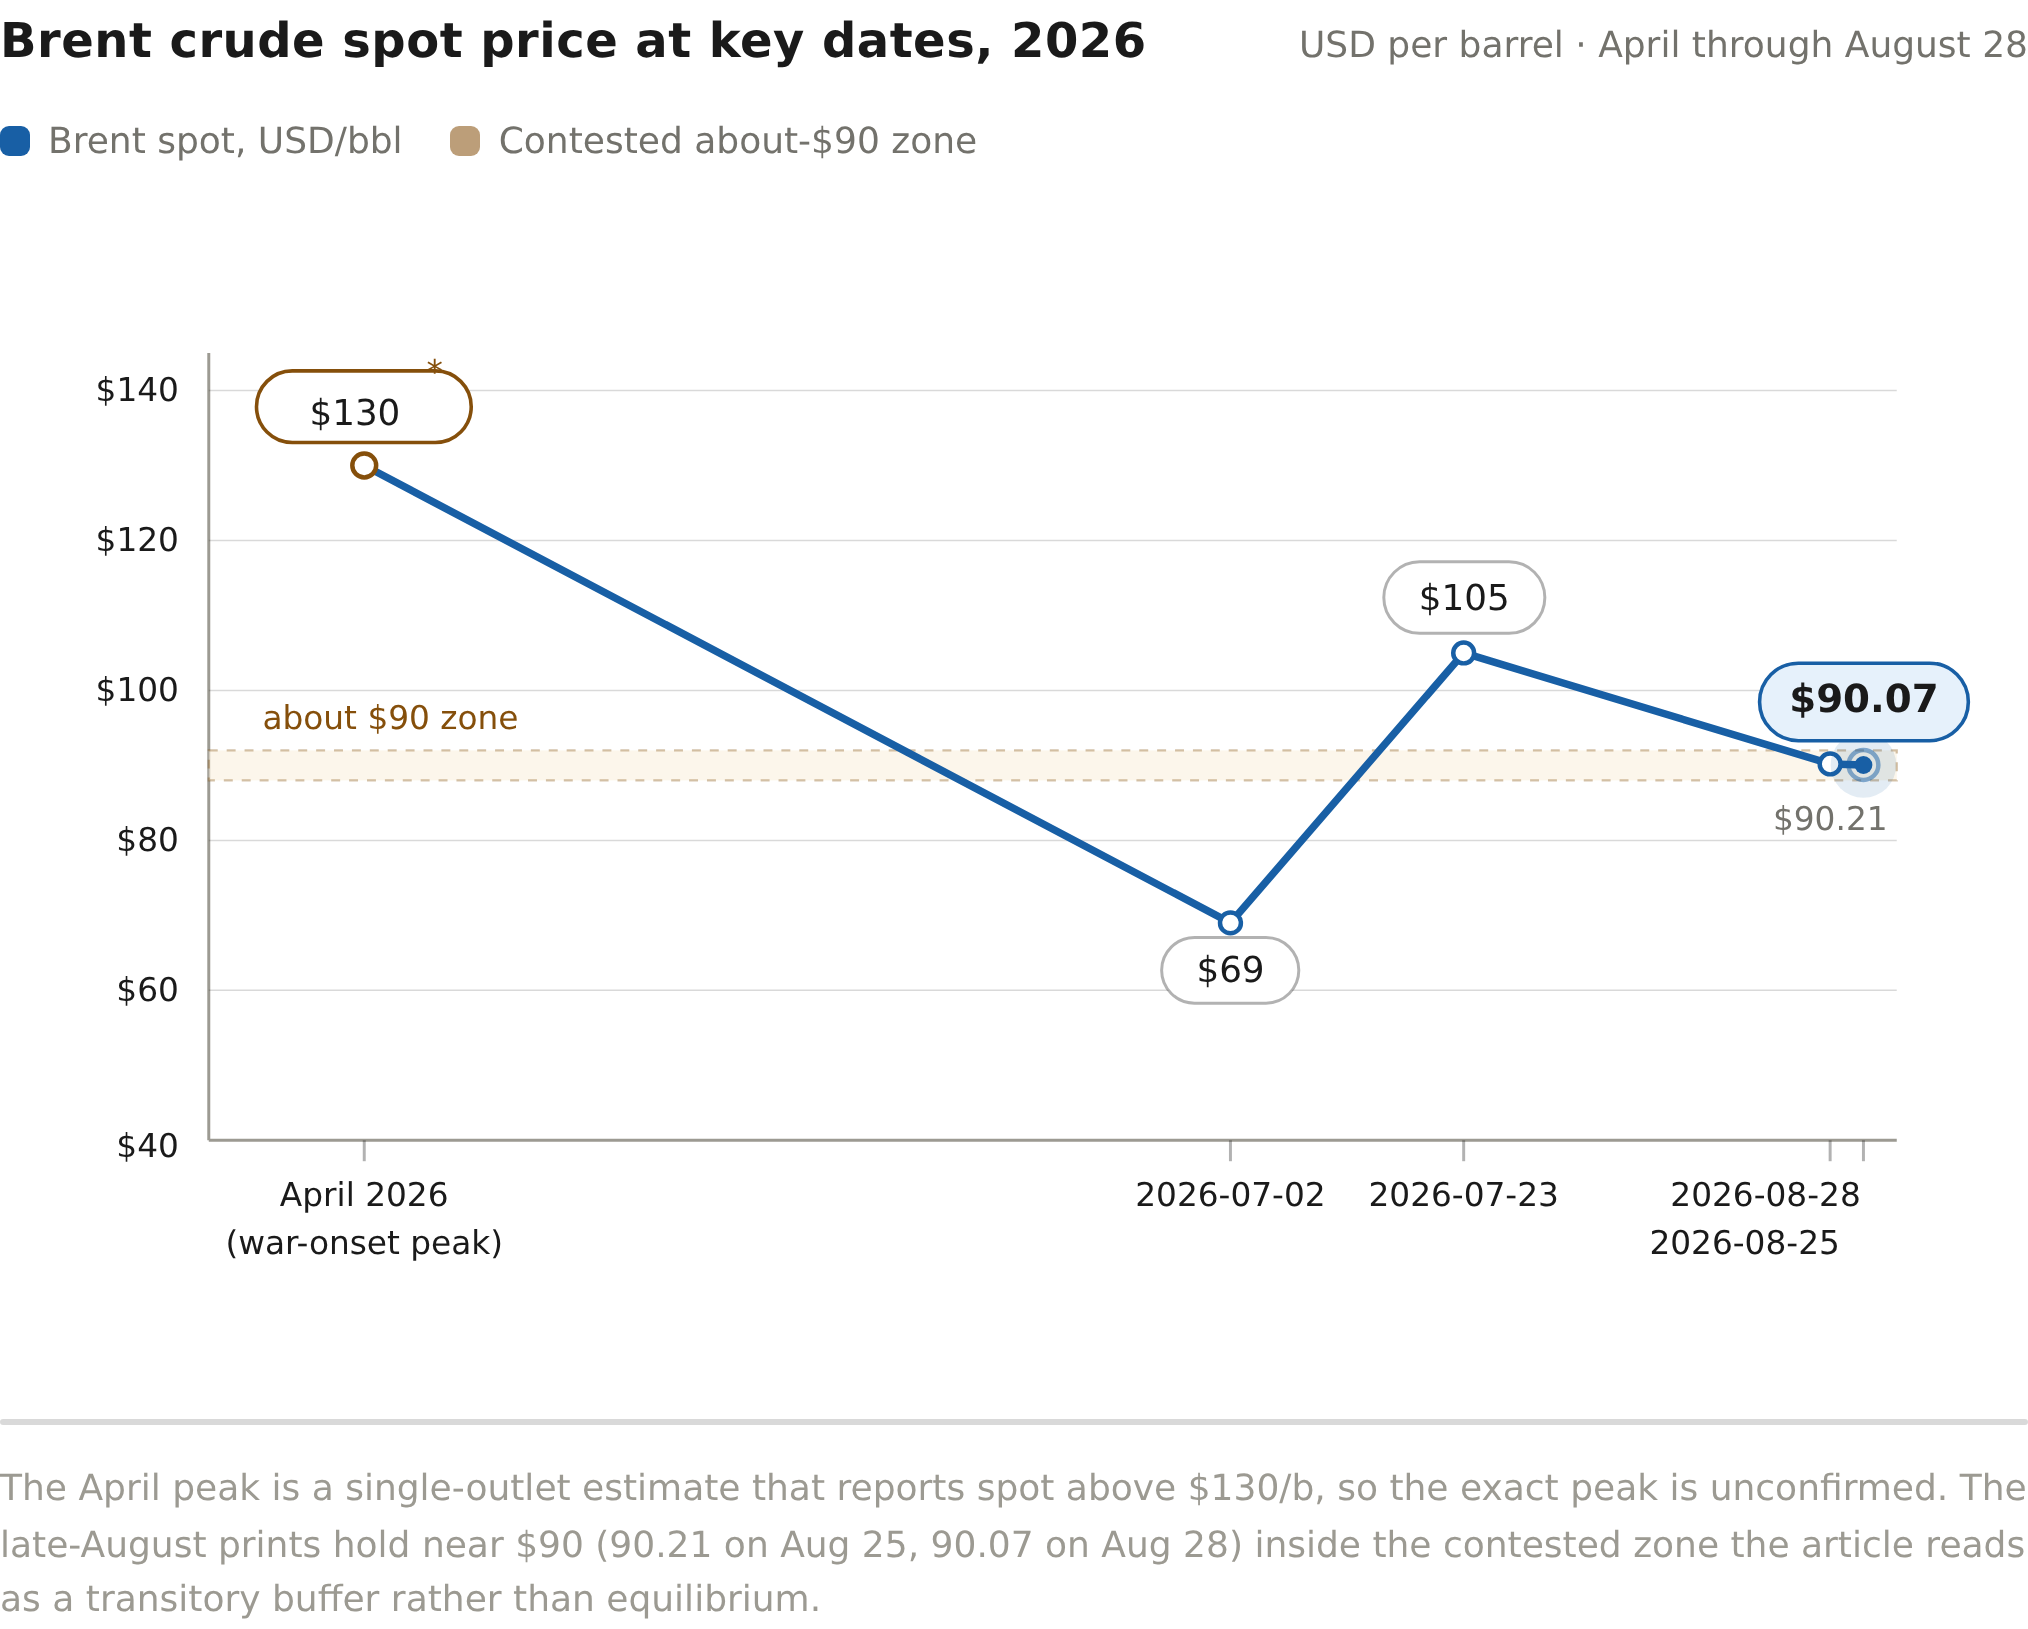
| Date | Brent spot (USD/bbl) | Note |
|---|---|---|
| April 2026 (war-onset peak) | 130 | exceeded $130/b; single-outlet estimate |
| 2026-07-02 | 69 | |
| 2026-07-23 | 105 | |
| 2026-08-25 | 90.21 | |
| 2026-08-28 | 90.07 |
EIA's own accounting shows the size of the gap. Flows of crude and petroleum liquids through the strait fell from 21.6 million barrels a day in late 2025 to 4.9 million barrels a day in the second quarter of 2026, a collapse of roughly 77% on the same measure. Production shut-ins, the barrels produced but unable to reach a buyer, averaged 5.5 million a day in July, and Gulf crude exports are down about 47% from a year ago. This is not a trim at the edges; it is the equivalent of taking a sizable oil exporter off the grid overnight.
The mainstream answer to how the market filled so large a hole without spiking is that it absorbed it. The IMF put it plainly: demand declined, production outside the Gulf increased, and inventories were drawn down, with spare capacity — the idle output that can be switched on quickly — put to work. That is the true story, and it is the entire case for calling $90 an equilibrium. But three of the four cushions are self-limiting. Demand decline is a one-way street with a floor; the world eventually needs the oil. Non-Gulf barrels, mostly American, take drilling time and shipping time and are finite. And spare capacity has been put to work, which means it is smaller than it was. That leaves inventory draws — pulling stored barrels out of tanks rather than buying current production — as the only mechanism that can keep the balance quiet across quarters. It is a metered mechanism.
EIA puts numbers on the meter. Global oil inventories fell an average 4.2 million barrels a day in the second quarter, and EIA forecasts another 3.8 million barrels a day of draws in the quarter we are in. Call it four million barrels a day of stored cover being spent, quarter after quarter, until something gives. The physical market reads the same tape. Gibson Shipbrokers' Richard Matthews, a man paid to watch barrel flows rather than price headlines, says the market was cushioned at first by massive pre-war inventory buildings — "but these buffers are now depleted" — and that the next six months could be "much more volatile and critical" for inventories if conditions do not change.
Which direction this breaks is the entire trade, and it is genuinely two-way. EIA's own forecast prices the unwinding case: it assumes strait traffic stays severely constrained through August, climbs slowly in September, and shut-in production restarts through 2026 into early 2027. On that path, Brent averages $85 this quarter, then falls to $78 in the fourth quarter and $69 in 2027.
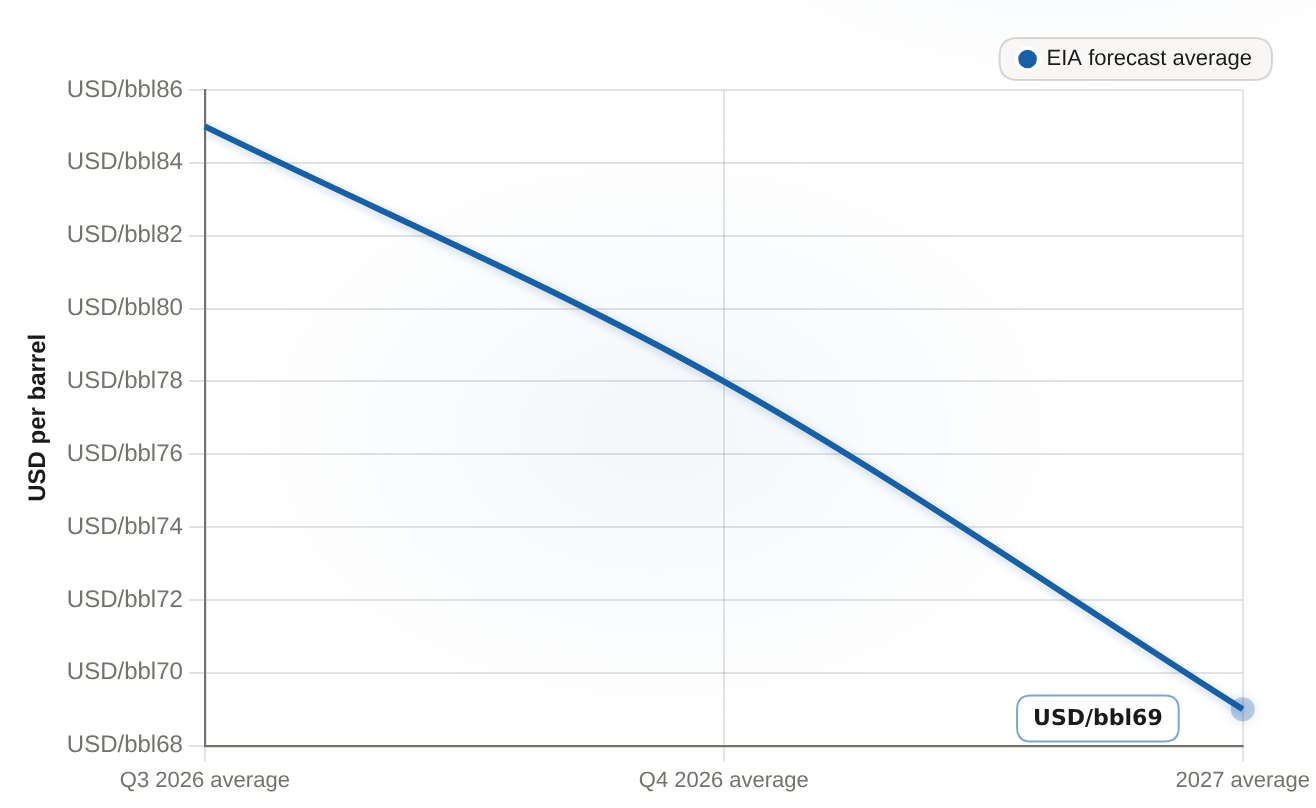
EIA forecasts Brent averaging $85 in Q3 2026, $78 in Q4 2026 and $69 in 2027, a stepwise downside path across the forecast horizon.
| Period | EIA forecast average (USD/bbl) |
|---|---|
| Q3 2026 average | 85 |
| Q4 2026 average | 78 |
| 2027 average | 69 |
The other leg activates if the buffers run out before any corridor deal closes. The comparison that matters is not six months of averages but last month, when a single renewed tanker-attack event threw Brent to $105, on a strait that had been closed for five months already. The spread between the two credible destinations — the $105 re-pricing on one side, EIA's $78-to-$69 unwind on the other — is on the order of $35 a barrel. What chooses between them is stored barrels and restarted wells, not the headline quote.
For an investor, the practical point is not to turn a range-capped price into a thesis. The actionable watch is the inventory data in the monthly EIA, OPEC and IEA balance reports, and any announcement that Gulf production is restarting. The energy equities have already re-rated on the resilience story, and by the standard that matters for a mature cash business they earned it. Per Ainvest data, ExxonMobilXOM-- is up 30.2% year to date near $157 and ChevronCVX-- up 32.5% near $202, each paying its dividend — 2.66% and 3.53% yields, respectively — out of roughly $30 billion and $27 billion of trailing free cash flow. That is the right way to hold a producer: on the cash it returns, not on the anchor price of oil. But the premium is not permanent: the same resilience that lifted the majors unwinds toward $78 if the corridor opens, and reprices toward $105 and beyond if the buffers empty first.
Call $90 a new equilibrium and you are betting that four finite cushions can hold a five-and-a-half-million-barrel-a-day hole open longer than the politics stay stuck. The metered draws say otherwise. If inventories keep falling around four million barrels a day and no deal closes, the direction of travel points toward last month's $105 and beyond; if the corridor reopens, EIA hands you $78 next quarter and $69 by 2027. Either way, the headline crude price was the least informative number on the tape. The inventory reports will tell you which leg you are on.








Comments
No comments yet