
NXP Semiconductors (NXPI) Explodes Higher: A 5.6% Surge Defies Short-Term Bearish Gravity
 Aime Summary
Summary
• NXP SemiconductorsNXPI-- (NXPI) surged 5.60% intraday, closing at $236.715 against a previous close of $224.17.
• The stock breached the critical 200-day moving average support zone, marking a decisive technical reversal.
• Trading volume reached 1,376,628 shares with a turnover rate of 0.55%, signaling robust institutional interest.
• Intraday range expanded significantly, climbing from an open of $230.00 to a high of $237.55.
NXP Semiconductors delivered a powerful intraday performance today, shattering near-term resistance levels and catching the market off guard. The 5.6% rally represents a significant momentum shift for the semiconductor giant, pushing the price well above its recent consolidation zone. This move not only erased immediate bearish sentiment but also positioned the stock to challenge deeper structural resistance, setting the stage for a potential trend reversal in the coming sessions.
Technical Rebound Ignites Momentum Surge
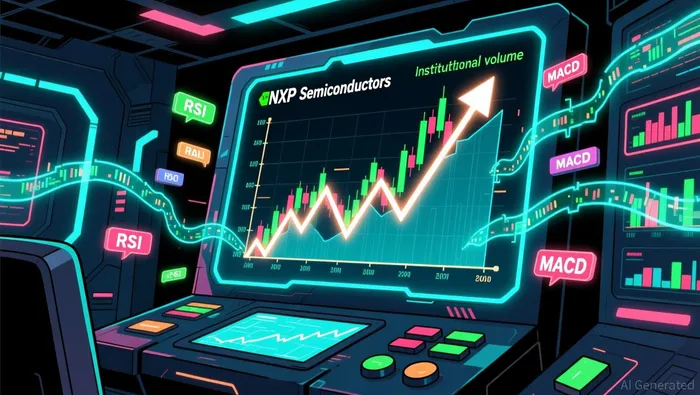
The primary driver of today’s surge appears to be a technical bounce from oversold conditions rather than a specific corporate announcement, as no new company news or sector-specific catalysts were reported. The stock had been trading in a short-term bearish trend, as indicated by the Kline pattern summary, and was deeply entrenched in negative momentum with an RSI of 17.76, signaling extreme oversold territory. This technical exhaustion likely triggered a sharp mean-reversion trade, where algorithms and value hunters stepped in to buy the dip. The price action confirmed this reversal, breaking above the intraday low of $229.155 and sustaining levels near the daily high of $237.55, demonstrating strong buyer conviction at these lower valuation levels.
Semiconductor Sector Shows Relative Strength
While the broader semiconductor sector remains volatile, NXP’s 5.6% gain significantly outpaced sector leader Nvidia (NVDA), which posted a modest 1.95% intraday increase. This divergence highlights NXP’s specific technical repair momentum rather than a broad-based sector rally. The stock’s performance suggests that capital is rotating into semiconductor names that have been disproportionately beaten down, seeking value in a sector where the long-term trend remains ranging. NXP’s ability to outperform the sector leader indicates that its move is idiosyncratic, driven by its own technical setup and valuation attractiveness relative to its 52-week low of $183.
Strategic Option Plays on Technical Reversal
Technical indicators suggest a volatile but potentially reversing environment. Key metrics include:
• 200-day Moving Average: $241.43 (Current price is below, indicating long-term resistance)
• RSI (14): 17.76 (Deeply oversold, suggesting high bounce probability)
• MACD Histogram: -4.62 (Negative momentum, but potentially narrowing)
• Bollinger Lower Band: $229.53 (Price has rebounded sharply from this support)

The trading setup focuses on capturing the immediate upside momentum while managing risk against the overarching 30-day downtrend. The 200-day moving average at $241.43 acts as the next major hurdle. Aggressive traders may look for options that offer high leverage to capitalize on this technical bounce. Based on the provided chain, we identify two high-potential contracts that balance delta sensitivity with gamma exposure and reasonable implied volatility.
Top Pick 1: NXPI20260821C230NXPI20260821C230--
• Code: NXPI20260821C230 (Call)
• Strike: $230 | Expiration: 2026-08-21
• Delta: 0.60 (Moderate price sensitivity)
• Gamma: 0.0118 (High sensitivity to price changes)
• Theta: -0.5352 (Significant daily time decay)
• IV Ratio: 62.07% (Mid-to-high volatility)
• Leverage: 14.65x | Turnover: $35,383
This contract stands out for its substantial volume and turnover, ensuring liquidity. The delta of 0.60 provides strong directional exposure, while the gamma allows for accelerated gains if the stock continues to climb. The high theta indicates rapid time decay, making this a trade for immediate momentum rather than long-term holding. The leverage ratio of 14.65x offers a balanced risk-reward profile for intraday to short-term swings.
Top Pick 2: NXPI20260821C260NXPI20260821C260--
• Code: NXPI20260821C260 (Call)
• Strike: $260 | Expiration: 2026-08-21
• Delta: 0.24 (Lower price sensitivity)
• Gamma: 0.0104 (High sensitivity to price changes)
• Theta: -0.3447 (Moderate daily time decay)
• IV Ratio: 57.38% (Mid-range volatility)
• Leverage: 57.52x | Turnover: $30,387
This out-of-the-money call offers explosive leverage potential with a 57.52x ratio. It is selected for its high gamma and substantial turnover, which facilitates easy entry and exit. The lower delta means it requires a more significant move to profit, but the high leverage amplifies returns if NXPNXPI-- breaks through resistance. The IV ratio of 57.38% is reasonable, avoiding the extreme costs of deeply OTM options.
Options Payoff Calculation Primer: For this payoff estimation, we assume a 5% upside scenario from current price (236.715) where for Call Option Payoff = max(0, ST - K) where ST is projected price and K is strike price and Put Option Payoff = max(0, K - ST) where ST is projected price and K is strike price. This projection helps evaluate option contracts' potential returns under a continued bullish move scenario.
If NXP sustains above $240, NXPI20260821C260 offers asymmetric upside potential for aggressive traders.
Capitalize on the Technical Bounce
Today’s surge is a clear technical correction from oversold levels, but sustainability will depend on holding above the $230 support and approaching the 200-day MA at $241.43. Investors should monitor volume to confirm if this is a genuine reversal or a dead cat bounce. The broader semiconductor context remains supportive, with sector leader Nvidia (NVDA) rising 1.95%, providing a favorable backdrop for tech stocks. Watch for a breakout above $241 to confirm trend reversal; otherwise, expect resistance. Traders should act swiftly to capitalize on the current momentum before time decay erodes option value.

TickerSnipe provides professional intraday stock analysis using technical tools to help you understand market trends and seize short-term trading opportunities.
Latest Articles
Stay ahead of the market.
Get curated U.S. market news, insights and key dates delivered to your inbox.


AInvest
PRO
AInvest
PRO




Comments
No comments yet