

QQQ closed Friday at 713.44. Its 50-day moving average — the line that separates a pullback from a breakdown — sits at 713.44. Same number, to the decimal. Price doesn't park dead on a moving average like that by accident, and the one scheduled event sitting on the calendar is Nvidia's earnings Wednesday after the close. A note before we go: this is written before Monday's open, so the technical setup below is anchored to Friday's cash close — the last completed session — and nothing in Monday's pre-market is confirmed as of this writing.
Say what you want about the AI spending jitters framing — the week that got us here was a de-rate, and a selective one. Ainvest data show the five-day damage landed on the highest-multiple chips: AMDAMD-- off 8%, AVGOAVGO-- down 6.2%, SMCISMCI-- down 6.5%, while AppleAAPL-- actually rose and Micron barely flinched. NvidiaNVDA--, the stock this index most depends on, closed the week 4.6% lower and stands 9.2% below its 52-week high. QQQQQQ-- finished down 2.41% on the week, the widest loss among the big index ETFs. Semis-led multiple compression, not a uniform risk-off week.
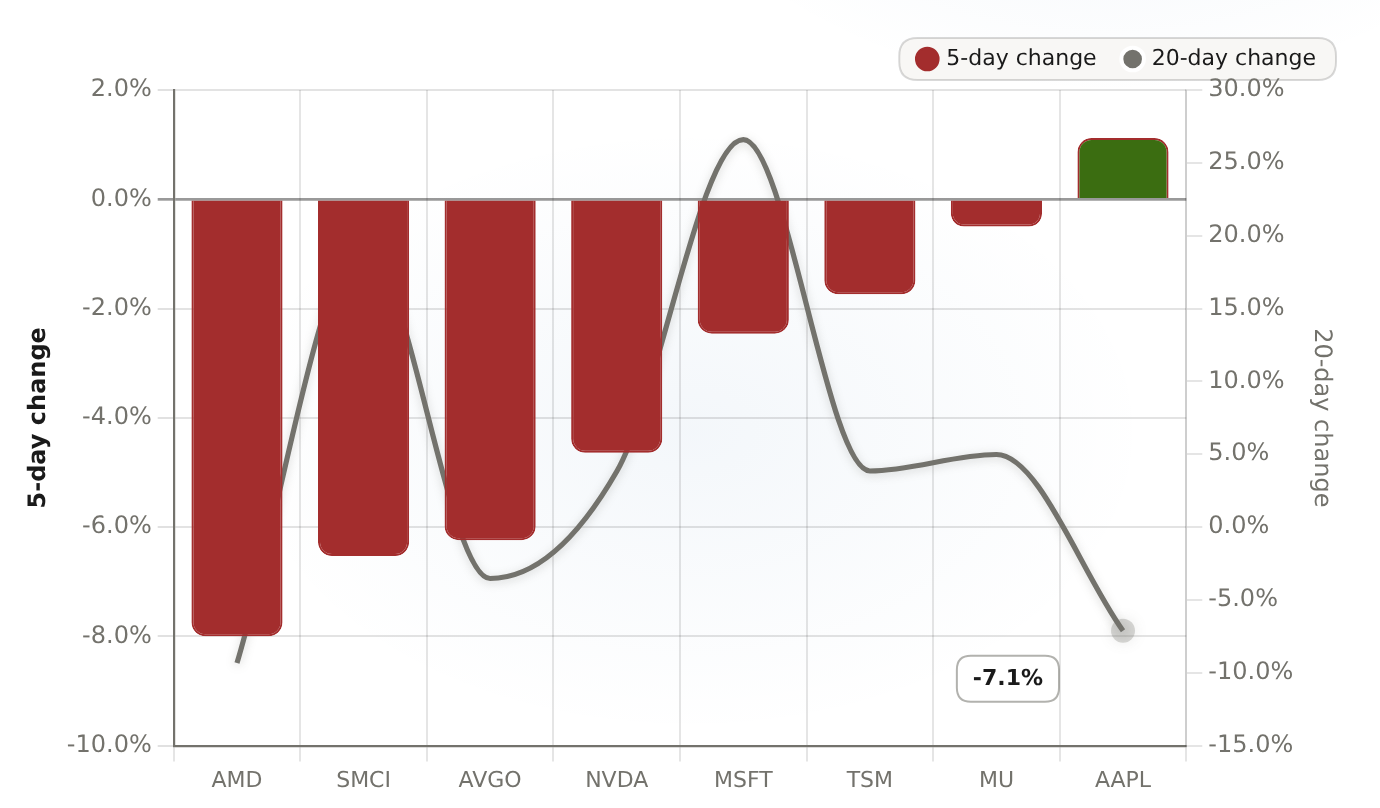
The week's de-rate was highly uneven - high-multiple semis led lower (AMD -8.0%, SMCI -6.5%, AVGO -6.2%, NVDANVDA-- -4.6%) while consumer tech held (MU -0.5%, AAPLAAPL-- +1.1%).
| Ticker | 5-day change | 20-day change |
|---|---|---|
| AMD | -8 | -9.33 |
| SMCI | -6.53 | 19.36 |
| AVGO | -6.24 | -3.53 |
| NVDA | -4.64 | 3.81 |
| MSFT | -2.46 | 26.6 |
| TSM | -1.74 | 3.85 |
| MU | -0.5 | 4.98 |
| AAPL | 1.12 | -7.11 |
Now the part of this setup most coverage races past. The headline beat is priced. The $91.85 billion consensus for the quarter sits just nine-tenths of a percent above Nvidia's own $91.0 billion guide — the company's forecast for the quarter it is about to report. Nvidia has beaten its own guide midpoint 13 straight quarters, but the margin of surprise has narrowed from 22.8% in Q2 fiscal 2024 to 4.6% last quarter. When consensus sits that close to the number management already put out, the current quarter is old news the day it prints — which is exactly why the preview put it this way: "the quarter after is where the argument is". The forward number, Nvidia's outlook for the quarter after this one stacked against the $103.1 billion analysts expect, is the control variable. That's what Wednesday decides.
Here is why a forward guide carries that kind of weight. The four biggest buyers of Nvidia's chips — Amazon, Alphabet, Microsoft, Meta — spent a combined $166 billion on capital expenditures in the second quarter, up 87% from a year earlier, and supplier revenue has historically followed those commitments by one to two quarters. So the Q3 guide is the market's live read on whether that compounding continues or hits its first inflection. Guide at or above the $103.1 billion line: the supplier chain stays bid, and the 50-day test resolves to the upside. Guide below it: 713.44 breaks, the de-rate stops being a valuation story and becomes a demand event, and there is open air down to the 200-day near 653 — about 8.5% below Friday's close. One moving part nobody watches until it changes: the guide was set excluding China. Any shift in that assumption moves the number all by itself.
The distribution into this print was broad, and it wasn't just retail. Ainvest capital-flow data show Nvidia took a net outflow of roughly $900 million last Friday, with every bucket — block, large, medium and retail — a net seller. Institutions were trimming into the event, not adding into it. QQQ, for its part, logged a net fund outflow: about $1.6 billion out the door, after more than $12.9 billion of buying over the past month. The money that built the position has been taking a little off the table at the margin.
So what is the options market charging for this print? Not panic. S&P 500 ETF put-call open interest is running near 2.56 — a heavily put-weighted tape already carrying a lot of protection. Yet Ainvest's options data put QQQ's average implied volatility — what options traders are pricing in for expected movement — at 19.5%, below the roughly 23% the index has actually been moving, annualized, over the past 20 trading days. Hedged, yes. Braced for an eject, no. Downside protection into Wednesday is comparatively cheap against the realized chop, and a guide that misses against that low an implied-volatility base leaves room for vol to spike and hedgers to add to the move. One honest boundary before I go further: the data only offer aggregate strikes, not strike-level walls, so I can't hand you a dealer-gamma read on the event. Call this a posture statement, not a measured plumb of the book.
The practical version for an ordinary investor is short. Don't add tech into Wednesday — a quarter priced nine-tenths of a percent above guidance is already nine-tenths of the way paid for. Read the Q3 guide, not the headline revenue: at or above the roughly $103.1 billion line, the compounding story holds; below it, respect the 713.44 break and don't reach for a falling knife into the 200-day gap. The week's decision was crowded into Friday's close the moment price printed dead on the line. Wednesday after the bell, Nvidia gets to say which side it lands on.








Comments
No comments yet