

Nvidia (NVDA) reports fiscal Q2 2027 results after the close on August 26, and the market already knows the headline. Every Q2 figure below is a consensus estimate or company guidance — nothing has been reported — but the setup is not in dispute: a consensus of $91.85 billion in revenue against management's own $91.0 billion guide, plus or minus 2%, earnings per share pegged near $2.08, and a guided 75% gross margin. Against the $46.74 billion NvidiaNVDA-- booked in the year-ago quarter, that consensus pencils out to roughly +97% year-over-year growth — a near-doubling the stock has already absorbed. A beat is close to assumed. The number that actually decides this position is the one the print won't answer: what management guides for the third quarter. That guide is the first live test of whether the hyperscaler capex curve driving Nvidia's data center business is still compounding or has started to digest, and it is where I am pointing this article.
What Wall Street Expects Is Largely Priced In
The setup reads clean. Consensus revenue of $91.85 billion sits only about 0.9% above the midpoint of the company's own guide — roughly the same cushion the Street held last quarter. The EPS line rounds out the same picture: analysts expect about $2.08 in adjusted earnings per share against guidance that implies a 75% gross margin. The distinction that matters is not whether Nvidia beats — it reliably has — but how much room that beat has to move the stock. When consensus hugs guidance, the beat moves the stock only if the forward number carries it.
The compounding is real, so let me show its shape. In Q1 FY27 — the quarter ended in April 2026, the last one on the books — Nvidia reported record $81.6 billion in revenue, up 85% year over year, with Data Center contributing $75.2 billion, up 92% and roughly 92% of the total; adjusted EPS of $1.87 beat the $1.76 consensus by $0.11. The quarterly path behind it: FY26 revenue stepped from $44.1 billion to $46.7 billion to $57.0 billion to $68.1 billion, then Q1 FY27 jumped to $81.6 billion. Revenue is compounding quarter after quarter. But the size of the beat over the guide has compressed from double digits in Q2 FY24 to about 4.6% in Q1 FY27 — the model and the market are converging. The doubling is priced.
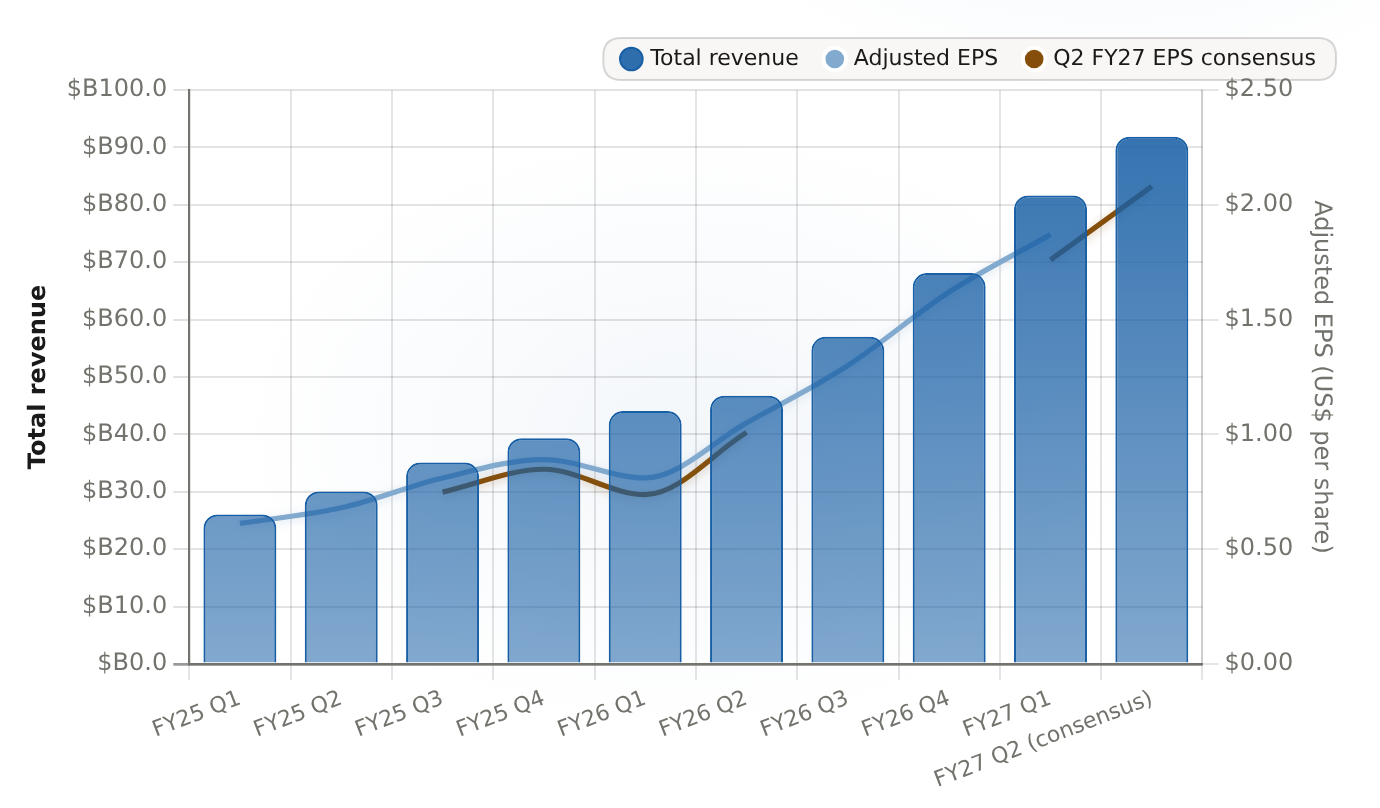
Revenue has climbed a near-vertical ramp through FY26 and FY27 while adjusted EPS has escalated in lockstep; the lone Q2 FY27 consensus mark ($91.85B revenue, $2.08 EPS) sits above the trailing actuals as the market's expected next print.
| Period | Total revenue ($B) | Adjusted EPS | Q2 FY27 EPS consensus |
|---|---|---|---|
| FY25 Q1 | 26.04 | 0.612 | N/A |
| FY25 Q2 | 30.04 | 0.68 | N/A |
| FY25 Q3 | 35.08 | 0.81 | 0.7482 |
| FY25 Q4 | 39.33 | 0.89 | 0.8479 |
| FY26 Q1 | 44.06 | 0.81 | 0.7371 |
| FY26 Q2 | 46.74 | 1.05 | 1.0084 |
| FY26 Q3 | 57 | 1.3 | N/A |
| FY26 Q4 | 68.1 | 1.62 | N/A |
| FY27 Q1 | 81.62 | 1.87 | 1.76 |
| FY27 Q2 (consensus) | 91.85 | N/A | 2.08 |
On the Street, the stance is unanimous and crowded: 52 of 54 analysts rate the stock Buy or Strong Buy with zero Sells, and the average 12-month target around $307 (range $218–$500) points at a company carrying a ~$5.25 trillion market cap. Valuation is the second wall the stock must climb: per Ainvest data, Nvidia trades near 33x trailing earnings and about 20.7x trailing sales — above AMD at ~18.6x and TSMC near 15.8x, with Broadcom closest at ~22.9x on the same sales basis. With the entire buy side long and the sales multiple at the top of the semiconductor group, the forward return has to come from growth compounding in front of the multiple. That is the guide's job.
The Capex Engine Behind the Demand
The demand engine is the four US hyperscalers, and their 2026 plans are the largest coordinated technology buildout on record. Amazon, Microsoft, Alphabet, and Meta have guided to roughly $760 billion of combined 2026 capex — about 85% above the ~$410 billion they spent in 2025: Amazon around $200 billion (versus ~$100 billion), Microsoft near $190 billion (versus ~$95 billion), Alphabet at $195–205 billion (versus ~$85 billion), and Meta at $125–145 billion (versus ~$70 billion). The near-term prints back the curve: combined capex rose 27% quarter over quarter to $166.0 billion in calendar Q2 2026, up 87% year over year. This is funded, guided, and compounding — the definition of visible demand.
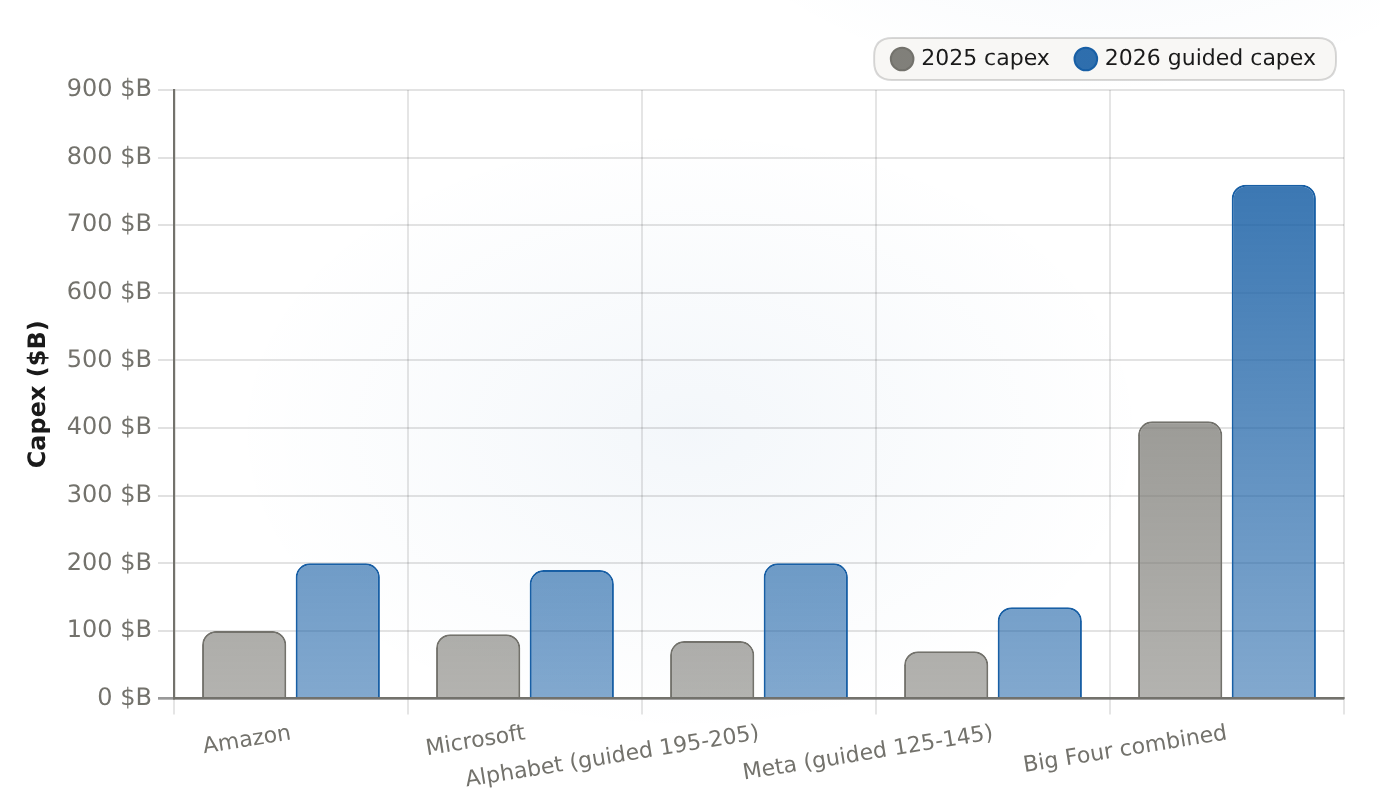
The Big Four hyperscalers plan to lift combined capex roughly +85% YoY, from ~$410B (2025) to ~$760B in guided 2026 — a step-change in AI infrastructure spend that underpins the Nvidia demand curve ahead of the Q3 guide.
| Company | 2025 capex ($B) | 2026 guided capex ($B) |
|---|---|---|
| Amazon | 100 | 200 |
| Microsoft | 95 | 190 |
| Alphabet (guided 195-205) | 85 | 200 |
| Meta (guided 125-145) | 70 | 135 |
| Big Four combined | 410 | 760 |
Now the relationship that makes Nvidia the derivative: hyperscaler capex historically precedes Nvidia's data center revenue by one to two quarters — the purchase order lands, then the accelerator revenue shows up. That lead argues the current capex wave should keep feeding the ~92%-of-total Data Center segment well past the Q2 print. But the market itself began to question the curve in July: shares of Amazon, Meta, and Microsoft tumbled after Alphabet raised its 2026 capex forecast, and Alphabet raised it again later in the month. When the spenders themselves draw scrutiny for overspending, the market is debating the exact variable that Nvidia's revenue is leveraged to.
The Q3 Guide Is the Readout
Which brings me to the number I care about most: the Q3 FY27 revenue guide against a consensus of about $103 billion. Guide at or above that level, and the read is that the capex curve is still compounding into Nvidia's order book. Guide below it, and you have the first inflection point of this cycle — early evidence that capacity is being digested rather than extended. The guide is a cleaner signal than the beat precisely because it converts "will the capex keep coming" into a single number management states on the call.
The mechanism runs through the supply gate, and that is why the guide is trustworthy rather than aspirational. CoWoS advanced packaging, HBM4 memory, and TSMC leading-edge foundry capacity are all constrained through 2027 — meaning what Nvidia can actually ship is gated by wafer and packaging allocation, not by demand alone. The Vera Rubin platform ramp is pulling HBM4, DRAM, and power components through the supply chain across 2026. The investment implication cuts both ways: the constraint protects pricing power and backlog discipline while it lasts, and it makes inventory the tell for when demand and supply stop matching.
The inventory tell is live right now. Finished-goods inventory reached $25.8 billion at Q1 FY27, up from $21.4 billion at Q4 FY26. For a company that deliberately builds inventory to ride a tight supply chain, that is a deferral rather than a red flag — but a few quarters of inventory outrunning sell-through is the classic precursor to a guide cut. It is the counter-signal I will check before I trust any forward number on the call.
The Watch List — and What Breaks the Thesis
No forecast is finished without stating what changes it. Five things I am watching on the call, in order of importance:
- The Q3 FY27 revenue guide versus the ~$103 billion consensus. At or above, the capex curve is compounding; below, it is the first digestion signal and a trigger to trim.
- Gross margin holding around 75% — the recovery from the Blackwell transition trough, when GAAP margin bottomed near 70% in mid-FY26 (Q3 FY26 printed 73.4% on a GAAP basis). The real test is the next transition: the Vera Rubin ramp will mechanically re-test that level as new yields, memory mix, and customer ramp costs get absorbed.
- Finished-goods inventory at $25.8 billion versus $21.4 billion the quarter before — the over-build counter-signal.
- China. Both the Q1 and Q2 FY27 guides assume zero data center revenue from China, so any change to that assumption is a swing factor in either direction — the April 2025 H20 export-license requirement shows how fast the policy can move.
- The supply gate: CoWoS, HBM4, and TSMC leading-edge capacity through 2027. Tight capacity is the reason pricing power survives.
And the explicit failure conditions — what would make me reduce rather than adjust: a Q3 guide below ~$103 billion, which signals capex digestion or order push-outs; gross margin eroding below ~75% during the Rubin transition; finished-goods inventory building faster than sell-through; custom-silicon share loss to Google's TPU, Meta's MTIA, Microsoft's MAIA, or Amazon's Trainium; or export controls escalating beyond the zero-China assumption baked into guidance. Any one of those on an earnings call is a reason to reconsider allocation, not to shrug.
The Verdict
The debate, as I keep coming back to it, is not whether Nvidia beats Q2 — it will, and the market knows it. The debate is whether the return profile from a $5.25 trillion, 20x-sales stock with a unanimous buy side is still the best home for new capital when so much of the near-doubling is already priced. My long-term thesis is unchanged: Nvidia remains on the right side of the AI infrastructure transition, and the demand evidence — roughly $760 billion of guided hyperscaler capex, compounding quarter over quarter — is intact. Full-year FY2027 consensus of roughly $391 billion in revenue and about $9.34 in earnings per share tells the same story at the annual level.
But believing the thesis is different from paying for it with everyone's consensus already in the price. This is my allocation call, with the time horizon stated: do not add into the print — the setup is crowded and the beat is assumed; hold the core long and make the Q3 guide the decision point. A guide at or above ~$103 billion confirms the capex curve is still compounding and supports holding through the Rubin transition into calendar 2027; a guide below it is the signal to trim into strength and redeploy into the next dark horse in the AI trade. This is a back-half-weighted story in the best case, and the marginal return from here is earned in the guide, not in the quarter.









Comments
No comments yet