

Everyone agrees where the AI froth lives: in Nvidia's valuation. The story the market tells itself is tidy — a chipmaker's price has run so far ahead of its earnings that the bubble has to be sitting right there. The problem is the number at the center of the story. Everyone is right that the trade is enormous. They may be wrong about what is actually enormous about it.
The number most people check is the earnings multiple, so check it. On trailing earnings, NvidiaNVDA-- trades at about 27 times (Ainvest data). Microsoft sits at 28.5, Apple at 36.2, TSMC at 31.7, AMD at 118 — Ainvest data, same day, same basis. The alleged epicenter of the froth, a $5.2 trillion company, is the cheapest major AI name on the board. It is not cheap because it has stalled: trailing revenue is up 83% year over year on a 64% operating margin (Ainvest data). Push the lens forward and the verdict holds: at the latest close of $217.55 against consensus fiscal-2027 earnings per share of roughly $9.29, the forward multiple sits around 23 times, with a GuruFocus cross-check putting it near 24x as of June.
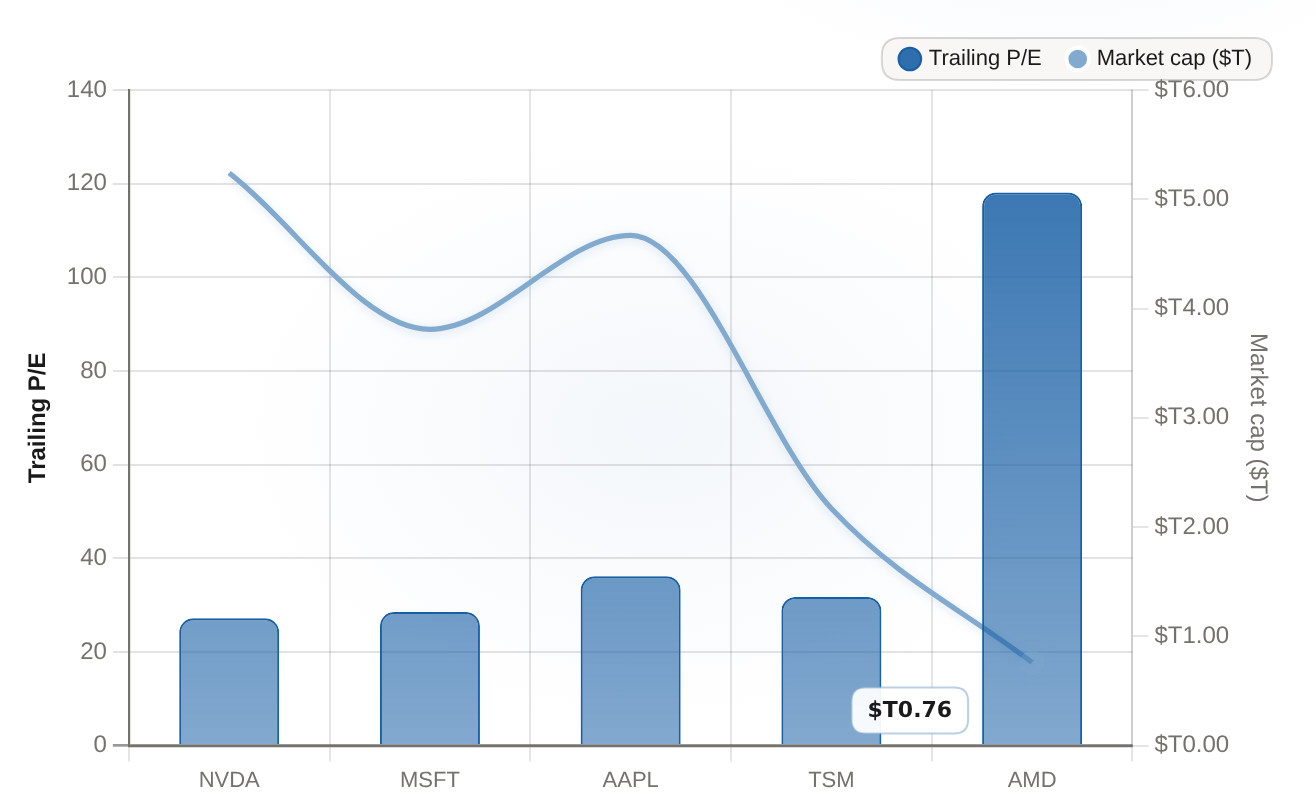
Nvidia trades at 27.2x trailing earnings, mid-pack below MSFT and far below AMD's 118x, so AI froth must be carried by leverage and concentration, not a headline multiple.
| Company | Trailing P/E | Market cap ($T) |
|---|---|---|
| NVDA | 27.18 | 5.24 |
| MSFT | 28.51 | 3.81 |
| AAPL | 36.19 | 4.67 |
| TSM | 31.74 | 2.17 |
| AMD | 118.13 | 0.76 |
So if the AI trade is a bubble, the case has to be built somewhere other than the multiple — in the machinery underneath the position: how concentrated the index has become, and how much of the trade is financed on borrowed money. Move the argument down to that level, and the question every headline asks — is Nvidia's P/E too high? — stops being the question.

Ten Names That Must All Be Right
The ten largest stocks in the S&P 500 were 40.7% of the index's weight at the end of 2025 — a record — while those same names were expected to deliver only about 32% of the index's earnings. Nvidia alone held nearly 8% of the index. That gap helps explain why the index trades at nearly a 30% premium to its equal-weighted twin, per RBC Wealth Management. Most people treat the index as 500 different bets. By weight it is a bet that ten companies, and really one technology script, keep working. It is diversified by count and concentrated by a single cause.
Record Concentration, Borrowed at a Record Price
And someone is paying leverage to own that. Margin debt reached $1.5 trillion in June, up 49% year over year, leaving the ratio of margin debt to the broad money supply above both the 2008 and dot-com peaks, per Ameriprise. Forty-nine percent is not a normal number: since 1997, margin-debt growth has run above 40% only three times — in late 1999-2000, mid-2007, and 2021 — and each time it was followed by a margin-debt drawdown of at least 35% and an equity correction, the firm notes. Three for three, with no guarantee of a fourth. But that base rate deserves more attention than the weekly rerun of "the multiple is too high."
The Cheap Stock Is the Amplifier
Nvidia has already shown the tape of what this stack does on a bad day. Around August 24, 2026, the shares fell about 9.5% in one session, erasing roughly $279 billion of market value — reported as the largest single-day loss for a US company — days before a beat-and-raise report. Not a broken quarter. Not a missed number. A plunge in the cheapest mega-cap on the board with no fundamental news attached. That is the thesis in one print: the stock whose multiple looks defensible is exactly the one that can do index-scale damage, because a 5% move in a mega-cap now moves the index more than a 10-15% move in smaller names, as Ameriprise quantified.
Then layer in the newest plumbing. Nearly 900 leveraged products trade in the United States, over 400 of them single-stock ETFs, and at their peak their daily rebalancing ran near $50 billion a session — roughly four times the pace at the start of the year, per Ameriprise. The daily rebalance is not optional: when the underlying stock falls, a leveraged fund must sell into the fall to hold its leverage constant, pushing the stock lower and forcing still more selling. Leveraged-product assets peaked near $207 billion at the end of June before easing to $168 billion by mid-July. The loop has already run live: in South Korea, leverage-driven forced selling in AI-linked names triggered circuit breakers with a frequency last seen in 2008 — a working replica, at smaller scale, of the plumbing now sitting under the US index.
Durable Earnings Don't Defuse Borrowed Money
The strongest objection deserves a straight answer: RBC argues this concentration rests on durable competitive advantages, high profitability and heavy AI capex, unlike prior speculative peaks — concentration alone is not a value tell. And the pop side still has buyers; Reuters read the August 26 bounce as proof that "Wall Street's AI obsession is far from over." Both can be true and this thesis still stand. Durable earnings answer whether the business is real. They do not answer what happens to a leveraged position when the financing turns. Ameriprise put it precisely: AI-driven earnings may be durable and visible while leverage mechanics make price swings outpace the fundamental changes.
For atmosphere rather than prophecy, weigh the narrative voices. The most prominent AI bull on cable warned in December 2025 that "the year of magical investing is over," then on August 27, 2026 declared that Nvidia's results "upended two bear narratives." Nobody has demonstrated that a television opinion predicts anything, and this argument does not lean on his flip. The direction of travel is the tell: the loudest sentiment has cycled to maximum conviction at the exact moment the debt and concentration numbers sit at records.
Watch the Money, Not the Multiple
A deleveraging unwind does not need an earnings miss. It needs a sustained markdown on borrowed money — a rate shock, a margin call by another name, a positioning reversal that forces the leveraged funds and the leveraged holders to sell the same names at the same time. That is why the check to run is not "is the P/E too high?" It is how much borrowed money sits behind ten names that are 40% of the index, and what that stack does the first afternoon it loses three percent and the rebalancing is obliged to sell into it.
And the thesis can lose, which is what makes it a thesis rather than a mood. If a markdown arrives and the stack absorbs it — no margin cascade, no forced liquidation, the leveraged funds rebalance into a bottom — then durable and visible earnings did their job and the plumbing lens is the wrong one. That is the observable test. Nothing about it requires waiting for the margin breakdown to act: you do not need to call the top to notice that record borrowed money is riding record concentration, and that the cheapest stock in the trade is the one with enough weight to break the index. Defending the multiple is how the crowd protects its narrative. The money underneath does not read the narrative.








Comments
No comments yet