

Nvidia has beaten analyst estimates for 13 straight quarters — and its shares have dropped after some of those beats anyway. It reports fiscal Q2 2027 results after the close into a setup where another beat is close to a foregone conclusion. So the puzzle tonight is not whether NvidiaNVDA-- clears the bar. It is why clearing it has so often left the stock flat — or lower.
The answer starts with how the bar gets set. When Nvidia reported a record $81.6 billion in fiscal Q1 in May, it pre-committed $91 billion of revenue for this quarter, plus or minus 2%. Street consensus sits just above that midpoint at roughly $92 billion, and BofA models a $94–95 billion print.
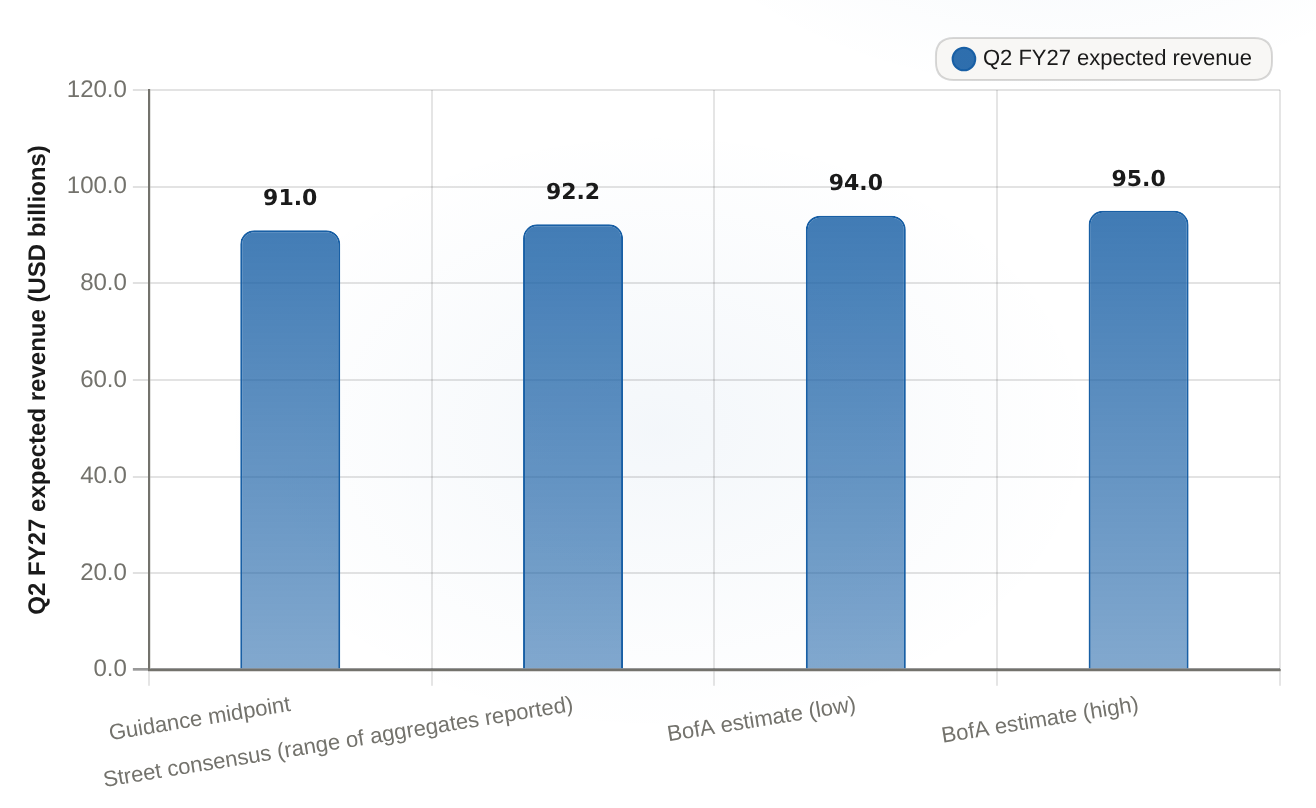
A plain quarterly beat is already priced in: the $92.2B street consensus and BofA's $94–95B range both sit above the company's own $91.0B guidance midpoint.
| Mark | Q2 FY27 expected revenue |
|---|---|
| Guidance midpoint | 91 |
| Street consensus (range of aggregates reported) | 92.2 |
| BofA estimate (low) | 94 |
| BofA estimate (high) | 95 |
A beat is close to arithmetic. The guided $91 billion alone is about 95% growth over last year's $46.7 billion. The spread between consensus and BofA — $3 to $4 billion — is 3–4% of the quarter and a rounding error against a market cap near $5.2 trillion (Ainvest data). When a base grows this fast, the size of the headline surprise stopped carrying information quarters ago.
History has been making that point for a year. In May, Nvidia beat and raised, at least 20 analysts lifted price targets — and the stock fell anyway. Part of the reason is the whisper number, the unofficial bar above published consensus. Beat the visible estimate but miss the whisper and the stock still deflates, and the whisper is unobservable. Nobody can forecast the direction of the close no matter how clean the quarter looks.
If the beat is known before the print, the market has to be paying for something else. The only un-priced number left is guidance for fiscal Q3. Street consensus sits near $104 billion; BofA models Nvidia guiding to $107–108 billion.
That spread, not the size of the print, is where the re-rating happens. Raise the guide above the street mark and forward estimates climb, holding the near-32x trailing earnings multiple in place against roughly 70% annual revenue growth (Ainvest data). Land at or below street and estimates reset, compressing the multiple even on a record quarter. One outcome confirms the growth story; the other reprices it. The beat decides neither.

So tonight, do not listen for the beat — that headline was written in May. Listen for the single number that follows: how Nvidia sets the Q3 guide against the roughly $104 billion street mark. That spread decides whether forward estimates climb or reset, and no size of print can overrule it. The beat is already priced. The guide is not.








Comments
No comments yet