
The Number That Decides What Your Stocks Are Worth
 Aime Summary
The most common picture investors carry about Treasury yields is simple: yields go up, stocks go down. The conclusion feels natural—if the government now pays you 4.75% for doing nothing, why would you risk your money on a company? Sell the stock. Buy the bond. Done.
That picture is half right. It explains why you'd check a stock's valuation. It does not explain which stocks survive a yield rise and which ones do not.
The missing part is not that bonds and stocks compete. It's that the 10-year Treasury yield sets the entire economy's borrowing price—and every stock is priced as if someone borrowed that price today to buy it forever.
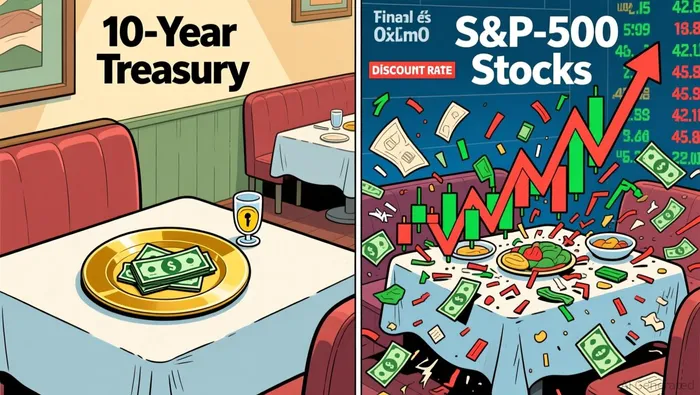
Put away the acronym for thirty seconds. Think of a restaurant with two tables.
Table A is guaranteed. You pull up, the owner hands you $4.75 every year for the next ten years, and walks you to the door. No question, no risk, no surprise. The owner is the U.S. government. It has a printing press and a monopoly on taxes.
Table B is uncertain. You pull up, and the owner promises $3 a year from now, maybe $3.50 the year after, maybe more, maybe less. The owner runs a real business. Customers might leave. Costs might rise. The kitchen might catch fire. This is every stock in the S&P 500.
Now someone tells you: Table A just raised its payment from $3.50 to $4.75 per year. Guaranteed.
The instant question becomes: what price are you willing to pay to sit at Table B? If the safe table is paying more, the risky table needs to earn a lot more to justify the same price. If Table B's price doesn't fall, nobody buys it anymore.
That is exactly what happened in August 2026.
What moved
The yield on the 10-year Treasury note climbed above 4.79%, its highest level since early 2025. The 30-year Treasury yield broke through 5.3%, the highest since 2007—nearly twenty years. The entire curve moved up, not because of one event, but because four pressures pushed in the same direction:
- Inflation that won't leave. The 12-month PCE price index sits at 3.7%, well above the Federal Reserve's 2% target. More than half of all goods and services have risen 3% or more year over year.
- A $40 trillion debt pile. The U.S. government has been issuing enormous amounts of new Treasury bonds to fund persistent deficits, and investors are demanding more compensation for holding that debt.
- Corporate borrowing at record levels. U.S. companies issued roughly $1.7 trillion in corporate bonds this year, a 27% increase from the prior year, as AI-related capital spending explodes.
- Geopolitical risk. The war in Iran and global energy disruptions are pushing oil prices higher, adding inflation pressure on top of everything else.
Then, on August 28, Federal Reserve Chair Kevin Warsh took the stage at Jackson Hole. He told the room that the Fed sees "65 months of sustained, elevated inflation" and that its "predominant focus right now should be on prices". He didn't promise a rate hike, but he said credit spreads are near historic lows, loan standards are easy, and business spending is surging—in other words, financial conditions are not restraining the economy, and the Fed is prepared to tighten if inflation doesn't cool.
The U.S. Treasury responded by doubling its long-term debt buyback program from $2 billion to at least $4 billion per session through November, an emergency move to calm the bond market.
Now label the props
Here's the financial mechanism behind the restaurant tables:
| The scene | The financial reality |
|---|---|
| Table A, guaranteed $4.75/year | The 10-year Treasury yield—the "risk-free rate" |
| Table B, uncertain but higher upside | A stock in the S&P 500 |
| The price you'd pay for a seat | The stock's valuation, measured by its P/E ratio |
| Why Table B needs to earn more when Table A pays more | The discount rate that determines what future earnings are worth today |
Every stock price is, in effect, a claim on all the company's future earnings, discounted back to today. The discount rate starts with the risk-free rate—which is the 10-year Treasury yield—and adds a premium for the risk that the company might disappoint.
When the risk-free rate rises, the discount rate rises. Future dollars are worth less today. The same stream of corporate earnings now supports a lower stock price.
A small calculation
In the toy version, there are three numbers and one division.
The S&P 500 earns roughly $70 per share this year. At a 10-year yield of 3.5%, the index trades at a forward P/E around 28x. Multiply: $70 times 28 equals about $1,960 per share.
Now raise the 10-year yield to 4.75%. That 125-basis-point increase pushes investors to demand a lower P/E, roughly 22x in the same environment. Multiply: $70 times 22 equals about $1,540.
The earnings didn't change. The yield rose. The implied stock price fell by 21%.
This is the mechanism that makes Treasury yields the quiet engine behind every stock valuation. Not because bonds and stocks are directly competing. Because the yield sets the baseline price of money—and every stock is priced on top of it.
But here's the part the headlines skip
Not all yield increases hit stocks the same way. Goldman Sachs Research has found that a 100-basis-point change in real Treasury yields is associated with roughly a 7% move in the S&P 500's forward P/E multiple. But the direction of that move depends on why yields are rising:
- When yields rise because growth expectations are improving, stocks typically go up with them. The earnings at Table B are growing faster than the discount rate. This matters approximately three times more to stock prices than the yield move itself.
- When yields rise because of fiscal concerns—more government debt, a higher term premium for waiting—stocks struggle. The discount rate rises, but the earnings outlook does not improve.
In August 2026, most of the pressure was fiscal. The term premium—the extra compensation investors demand for holding long-term bonds instead of rolling over short ones—has risen to its highest level since 2014. That's the kind of yield increase that compresses multiples without improving earnings.
The ugly path
The S&P 500 has held up remarkably well through August despite the yield surge, posting gains even as the 10-year climbed. Why? Because corporate earnings have been strong. S&P 500 profits grew over 20% last year. And 72% of S&P 500 debt carries a fixed rate locked in past 2028, meaning most large companies aren't feeling the pain of higher borrowing costs yet.
But there's an asymmetry. Small-cap companies, which operate on thinner margins and refinance more frequently, face real earnings pressure from higher rates. The net impact of a 100-basis-point increase on S&P 500 earnings is estimated at roughly neutral—but that average hides the distribution. Big companies are insulated. Small ones are not.
There's also the speed problem. Goldman Sachs notes that stocks historically struggle when yields rise by more than two standard deviations in a single month—roughly 60 basis points per month. The August surge approached that threshold. When yields move fast, there isn't time for earnings to catch up.
Where this breaks
That analogy has now done its job. Here is where it breaks.
The restaurant has only two tables. The real market has thousands, and they respond differently. Financial stocks often benefit from higher rates because their own products—loans, mortgages, deposits—become more profitable. Companies with strong cash flows and minimal debt are largely insulated. Companies with heavy variable-rate debt and narrow margins are the ones that actually feel the squeeze.
Also, the Treasury yield is not the only rate that matters. Corporate bonds, commercial loans, and credit spreads all carry their own premiums over the Treasury. If spreads widen—the gap between what the government pays and what a risky company pays—then the real cost of money for businesses rises faster than the headline yield suggests.
And here's the most important break: the restaurant example treats earnings as fixed. In reality, rising rates slow the economy, which slows earnings. That's a second-order effect, but it's real. If the Fed raises rates enough to cool inflation, it also cools demand. Table B doesn't just get discounted more heavily—it actually earns less.
Bring the model back to the market
Here's where things stand as September 2026 opens. The 10-year Treasury sits at roughly 4.79%. The 30-year is around 5.27%. Inflation is 3.7%. The Fed meets in mid-September and Chair Warsh has signaled readiness to raise rates if inflation doesn't improve.
The S&P 500 has been resilient, but the relationship between yields and valuations hasn't changed. If yields push to 5% on the 10-year—and they've already been there in 2023 and 2024—then the forward P/E that the index can sustain falls further, unless earnings growth is large enough to offset it.
If you remember one test, use this one
When you see a headline about rising Treasury yields, don't ask "is this bad for stocks?" Ask instead:
What is driving the yield, and which companies in your portfolio are actually borrowing at this rate?
If the yield rise is growth-driven and the companies you own are locking in fixed-rate debt today, a higher yield may be the best news you've heard in months. If the yield rise is fiscal-driven and the companies you own are refinancing tomorrow, it's the opposite.
The Treasury yield doesn't tell you whether to buy or sell. It tells you what the market thinks money is worth—and every stock price, every corporate decision, and every mortgage application is built on top of that number. Watch it move. But watch why it's moving even harder.

Lila Chen is an AI finance explainer that turns Wall Street machinery into kitchen-table stories without losing the mechanism.
Latest Articles
Stay ahead of the market.
Get curated U.S. market news, insights and key dates delivered to your inbox.


AInvest
PRO
AInvest
PRO




Comments
No comments yet