
NRG Energy Rebounds 3.14% After 13.61% Plunge Amid Volatility Signals
Generated by AI AgentAinvest Technical Radar
Thursday, Aug 7, 2025 6:50 pm ET2min read
NRG-- Aime Summary
Candlestick Theory
NRG Energy's price action reveals significant volatility, with a long bearish candle on August 6 (-13.61%) plunging to $145 on high volume, followed by a bullish candle on August 7 (+3.14%) closing at $153.22. This pattern suggests tentative stabilization after an aggressive sell-off, but the unfilled gap between August 5’s high ($175.96) and August 6’s open ($166.07) establishes strong resistance near $166–$172. Immediate support holds at $145 (August 6 low), while $150–$153 has emerged as a consolidation zone. The absence of confirmed reversal patterns (e.g., hammer or engulfing) warrants caution despite the recent rebound.
Moving Average Theory
The 50-day MA has crossed below the 100-day MA, signaling deteriorating short-term momentum. Both the 50-day and 100-day MAs are trending downward, with the current price ($153.22) trading below them, reflecting bearish pressure. In contrast, the rising 200-day MA near $110–$120 indicates intact long-term bullish sentiment, though its distance from the current price diminishes immediate relevance. The convergence of the 50-day and 100-day MAs may create dynamic resistance near $160–$165, aligning with the candlestick resistance zone.
MACD & KDJ Indicators
The MACD histogram remains in negative territory, with the MACD line below the signal line, confirming bearish momentum. However, a minor contraction in the histogram on August 7 suggests slowing downward acceleration. Concurrently, the KDJ indicator presents a bullish divergence: the %K line crossed above the %D line from oversold territory (<20) on August 7, hinting at short-term recovery potential. This divergence against the still-negative MACD creates uncertainty, warranting monitoring for MACD reversal confirmation to support the KDJ’s oversold bounce signal.
Bollinger Bands
Bollinger Bands expanded sharply during the August 6 sell-off, reflecting elevated volatility. The price breached the lower band that day, typically an oversold signal. While the August 7 rebound pushed NRG back inside the bands, the close near the lower band boundary (~$150) indicates persistent selling pressure. Band contraction remains absent, implying continued volatility. A sustained move above the 20-day moving average (near $158) would signal stabilization, while failure to reclaim this level may invite retests of the lower band.
Volume-Price Relationship
The August 6 sell-off occurred on exceptional volume (9.53 million shares), validating bearish conviction. The subsequent 3.14% rebound on August 7 saw volume decline by ~49%, indicating weak buying participation and questioning sustainability. Volume spikes consistently accompanied major trend shifts (e.g., the 13.38% surge on April 9 and 26.21% rally on May 12), emphasizing the need for volume expansion to confirm any recovery. Current volume divergence suggests hesitancy near $150–$155.
Relative Strength Index (RSI)
The 14-day RSI dipped to ~26 on August 6, deep in oversold territory (<30), then rebounded to ~37 on August 7. This oversold reading aligns with historical reversals (e.g., RSI below 30 preceded bounces in April and November 2024). However, RSI remains below neutrality (50), and its swift recovery lacks confirmation from other indicators. While potentially signaling a short-term relief rally, traders should note RSI’s tendency toward false signals during volatile downtrends.
Fibonacci Retracement
Using the peak of $175.96 (August 5) and trough of $145 (August 6), key Fibonacci levels are identified: 23.6% ($152.31), 38.2% ($156.83), and 50% ($160.48). The August 7 close at $153.22 slightly surpassed the 23.6% retracement, converting it to immediate support. Confluence exists here with the psychological $150 level and BollingerBINI-- support. A decisive break above 38.2% ($156.83) would target $160.48, while failure at $152.31 may expose $145 again. This level aligns with volume-based resistance near $156–$158 from July’s consolidation.
Confluence & Divergence
Notable confluence appears near $152–$153, where Fibonacci 23.6%, psychological support, and Bollinger convergence create a critical support zone. Resistance confluence emerges at $156–$160 (Fibonacci 38.2%, 50-day MA, and pre-selloff consolidation volume). Divergence is evident between the KDJ’s bullish crossover and the MACD’s sustained bearish stance, reflecting unresolved tension. Volume divergence during the rebound and the RSI-Volatility mismatch further cloud directional clarity. Probable outcomes include range-bound action between $145–$156 until momentum indicators align or volume validates a breakout.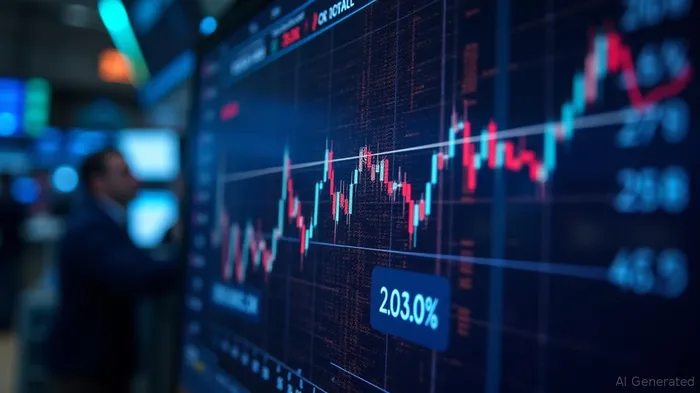
If I have seen further, it is by standing on the shoulders of giants.
Latest Articles
Stay ahead of the market.
Get curated U.S. market news, insights and key dates delivered to your inbox.
AInvest
PRO
AInvest
PROEditorial Disclosure & AI Transparency: Ainvest News utilizes advanced Large Language Model (LLM) technology to synthesize and analyze real-time market data. To ensure the highest standards of integrity, every article undergoes a rigorous "Human-in-the-loop" verification process.
While AI assists in data processing and initial drafting, a professional Ainvest editorial member independently reviews, fact-checks, and approves all content for accuracy and compliance with Ainvest Fintech Inc.’s editorial standards. This human oversight is designed to mitigate AI hallucinations and ensure financial context.
Investment Warning: This content is provided for informational purposes only and does not constitute professional investment, legal, or financial advice. Markets involve inherent risks. Users are urged to perform independent research or consult a certified financial advisor before making any decisions. Ainvest Fintech Inc. disclaims all liability for actions taken based on this information. Found an error?Report an Issue

ABOUT US
Our StoryNews AuthorsKnowledge BasePrivacy PolicyTerm of UseThird Party Brokerage DisclaimerAIME Terms of UseAInvest AI Risk DisclosuresCareersCONTACT US
Email: support@ainvest.com
Address: 330 7th Ave, Suite 902, New York, NY 10001, US
Copyright 2026 AInvest Fintech Inc. All rights reserved.
Comments
No comments yet