
Novo Nordisk Rallies 5.28% On Strong Volume As Technicals Turn Bullish
Generated by AI AgentAinvest Technical Radar
Monday, Aug 18, 2025 6:05 pm ET2min read
NVO-- Aime Summary
Candlestick Theory
Novo Nordisk exhibits a robust short-term bullish structure, evidenced by three consecutive white candles culminating in a 5.28% three-day rally. The most recent session (August 15) closed near its high (52.41 vs. 52.75 high), indicating sustained buying pressure. Key resistance emerges at 53.94 (July 29 breakdown gap), while support consolidates at 50.90, reinforced by the August 13 reversal candle’s low. The absence of significant upper shadows during the rally suggests limited immediate selling pressure, though the July 29 bearish marubozu (high: 55.37, close: 53.94) remains a critical overhead supply zone.
Moving Average Theory
The 50-day (65.32), 100-day (70.15), and 200-day (85.43) moving averages remain in a bearish descending sequence, confirming the primary downtrend. However, the current price (52.41) has recently crossed above the 20-day exponential average (approx. 50.50), signaling short-term momentum improvement. The persistent gapGAP-- between price and longer-term averages underscores significant residual bearish pressure, with the 50-day MA likely acting as dynamic resistance near 65.32. No golden cross formations are evident, suggesting trend reversal confirmation remains premature.
MACD & KDJ Indicators
The MACD histogram has shifted to positive territory for the first time since April, with the signal line crossover occurring on August 12, indicating emerging bullish momentum. Concurrently, the KDJ oscillator shows an overbought condition (K: 82, D: 75, J: 91), which aligns with the recent vertical price ascent. However, this KDJ overextension diverges mildly from MACD’s nascent recovery, hinting at potential near-term consolidation. The MACD’s bullish crossover below the zero line suggests intermediate-term recovery potential but within a broader downtrend context.
Bollinger Bands
Price has rebounded sharply from the lower BollingerBINI-- Band (45.50 on August 7), penetrating the 20-day moving average (mid-band) and now testing the upper band near 52.50. The bands contracted notably during July’s volatility climax (bandwidth narrowing 30%), with the recent expansion supporting a short-term directional breakout. However, the proximity to the upper band—coupled with overbought KDJ readings—increases the probability of a minor pullback to consolidate gains. A sustained close above the upper band would signal unusual strength.
Volume-Price Relationship
Volume validation strengthens the current rally: August 13–15 recorded 19.4M, 12.6M, and 17.6M shares traded, exceeding the 30-day average volume. The August 7 reversal candle (7.45% gain on 40.8M shares—the highest volume in three months) marked a capitulation low, confirming institutional accumulation. Notably, recent up days exhibit higher volume than down days (e.g., August 11’s 16.2M shares on a -2.37% day vs. August 15’s 17.6M on +2.87%), underscoring buyer dominance. However, the slightly reduced volume on the most recent up day warrants monitoring for exhaustion.
Relative Strength Index (RSI)
The 14-day RSI has surged from oversold (28.5 on August 7) to 62.5, crossing above 50 for the first time since late June. While not yet overbought (>70), the velocity of this ascent—from oversold to neutral in seven sessions—implies strong momentum. No bearish divergence is evident relative to price, as both have ascended synchronously. Historically, RSI reversals from oversold during this downtrend (e.g., April, June) resulted in 15–20% rallies before stalling, suggesting comparable near-term upside potential toward 54.90–55.00 resistance.
Fibonacci Retracement
Using the primary downtrend swing from the July 29 high (69.00) to the August 7 low (45.38), key Fibonacci levels are calculated: 38.2% (54.90), 50% (57.19), and 61.8% (59.48). The current rally has breached the 23.6% retracement (51.65), establishing it as support. The 38.2% level (54.90) aligns precisely with the July 31 swing low (50.03) and the psychological $55 resistance, creating a high-probability confluence zone. A failure to surpass 54.90 would reinforce the broader downtrend, while a close above targets 57.19 next. Secondary Fibonacci resistance emerges at 61.8% (59.48), corresponding to the June 24 high (70.73) breakdown point.
Confluence and Divergence Synthesis
Confluence is observed between Fibonacci resistance (54.90), the 50-day MA (65.32), and the July breakdown gap (53.94–69.00), creating a formidable resistance cluster near 54.90–55.00. Volume, MACD, and RSI align bullishly for near-term upside toward this zone. A critical divergence exists between KDJ’s overbought signal and MACD’s early-cycle bullish crossover, implying potential consolidation before further advancement. Should Novo NordiskNVO-- overcome the 54.90 confluence, it would likely challenge the 50% Fibonacci level (57.19), though the primary downtrend remains intact below the 200-day MA (85.43).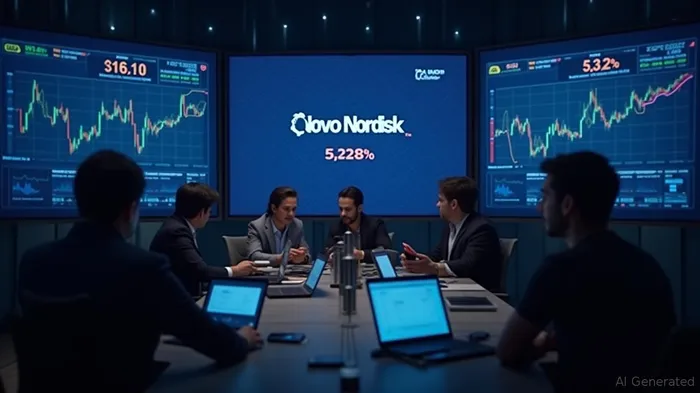
If I have seen further, it is by standing on the shoulders of giants.
Latest Articles
Stay ahead of the market.
Get curated U.S. market news, insights and key dates delivered to your inbox.
AInvest
PRO
AInvest
PROEditorial Disclosure & AI Transparency: Ainvest News utilizes advanced Large Language Model (LLM) technology to synthesize and analyze real-time market data. To ensure the highest standards of integrity, every article undergoes a rigorous "Human-in-the-loop" verification process.
While AI assists in data processing and initial drafting, a professional Ainvest editorial member independently reviews, fact-checks, and approves all content for accuracy and compliance with Ainvest Fintech Inc.’s editorial standards. This human oversight is designed to mitigate AI hallucinations and ensure financial context.
Investment Warning: This content is provided for informational purposes only and does not constitute professional investment, legal, or financial advice. Markets involve inherent risks. Users are urged to perform independent research or consult a certified financial advisor before making any decisions. Ainvest Fintech Inc. disclaims all liability for actions taken based on this information. Found an error?Report an Issue

ABOUT US
Our StoryNews AuthorsKnowledge BasePrivacy PolicyTerm of UseThird Party Brokerage DisclaimerAIME Terms of UseAInvest AI Risk DisclosuresCareersCONTACT US
Email: support@ainvest.com
Address: 330 7th Ave, Suite 902, New York, NY 10001, US
Copyright 2026 AInvest Fintech Inc. All rights reserved.
Comments
No comments yet