
Novo Nordisk's 5.80% Surge on 2025-12-10 Sparks Bullish Momentum as MACD Confirms Strength and RSI Hits Overbought Zone
Candlestick Theory
Novo Nordisk’s recent 5.80% price surge on 2025-12-10 forms a strong bullish candle, suggesting aggressive buying momentum. Prior sessions reveal mixed signals: a bearish engulfing pattern on 2025-12-08 (2.28% decline) was followed by a sharp reversal on 2025-12-10, hinting at potential short-term support near $46.77 (2025-12-08 close) and resistance at $49.05 (2025-12-10 close). 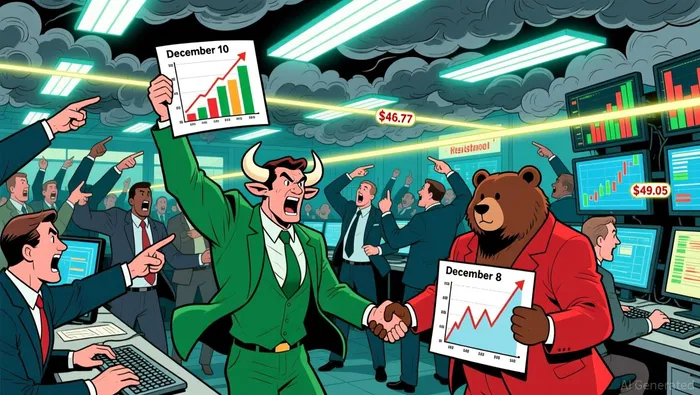 Key support levels are reinforced by prior lows at $46.36 (2025-12-09) and $47.06 (2025-11-25), while resistance aligns with recent highs at $49.35 (2025-12-05) and $50.26 (2025-11-12).
Moving Average Theory
The 50-day moving average (approximately $48.50–$49.00) appears to be ascending, while the 200-day MA (around $55.00–$56.00) remains above the 50-day, indicating a longer-term bearish bias. However, the recent rally has brought the price closer to the 50-day MA, suggesting short-term buyers are gaining control. A crossover above the 200-day MA would signal a potential trend reversal, but current data suggests the stock remains in a consolidation phase between the 50-day and 200-day averages.
MACD & KDJ Indicators
The MACD histogram shows a positive divergence post-2025-12-10, with the line crossing above the signal line, reinforcing bullish momentum. The KDJ (Stochastic) oscillator, however, indicates overbought conditions (K >80) following the 5.80% surge, raising the probability of a near-term correction. While the MACD supports continuation, the KDJ’s overbought reading suggests caution, as extreme overbought levels often precede pullbacks.
Bollinger Bands
Volatility spiked on 2025-12-10, with the price surging to the upper Bollinger Band (approximately $49.05–$49.50). This expansion suggests heightened short-term volatility, likely driven by strong buying pressure. The narrow bands observed in late November (e.g., 2025-11-24 to 2025-11-26) indicate a prior period of consolidation, now broken by the recent move. A retest of the lower band (around $46.00–$47.00) may occur before the trend resumes.
Volume-Price Relationship
The recent 5.80% rally was accompanied by elevated volume (16.96 million shares), validating the move’s strength. However, the preceding 2.28% drop on 2025-12-08 occurred on lower volume (14.87 million), suggesting weak bearish conviction. Divergence emerges in mid-November, where declining volume during a 5.58% drop on 2025-11-24 failed to sustain the downward momentum, hinting at potential buyer accumulation.
Relative Strength Index (RSI)
The RSI spiked to overbought territory (>70) following the 2025-12-10 surge, signaling a high probability of a near-term pullback. Historical data shows similar overbought readings in late November (e.g., 2025-11-26 at ~70) were followed by corrections. However, the RSI’s failure to form bearish divergences during the 2025-12-08–2025-12-10 rally suggests strong underlying demand, implying a retest of overbought levels may be necessary before a sustainable reversal.
Fibonacci Retracement
Key Fibonacci levels from the recent high of $49.05 (2025-12-10) to the prior low of $44.97 (2025-11-24) are critical. The 38.2% retracement ($46.60) and 50% retracement ($47.01) align with established support zones, suggesting these levels may act as magnets for price action. A break below the 61.8% level ($45.30) would signal a deeper correction, while a sustained move above $49.35 (the 23.6% retracement) could extend the uptrend.
If I have seen further, it is by standing on the shoulders of giants.
Latest Articles
Stay ahead of the market.
Get curated U.S. market news, insights and key dates delivered to your inbox.
AInvest
PRO
AInvest
PRO
Comments
No comments yet