
Nomina’s Surge Fails as Sellers Defend 0.00196
 Aime Summary
Summary
- Nomina/Tether exhibits high volatility with a 12.2% 24h surge followed by a sharp 5.9% pullback.
- Volume spiked significantly at 02:00 and 04:00 UTC, indicating intense institutional or whale activity.
- Price rejected key resistance near 0.00196, forming a bearish engulfing pattern with long upper wicks.
- Market structure remains in an uptrend phase based on 15-day higher highs, but short-term momentum is cooling.
- Immediate support lies at 0.00170, with upside potential if price holds above this level.
Market Overview: Volatile Rejection at Resistance
Nomina/Tether (NOMUSDT) experienced extreme volatility on 2026-08-06, with the latest 1-hour candle closing at 0.00171 after a high of 0.00181. The 24-hour total volume reached approximately 124 million NOM, significantly exceeding the 7-day average hourly volume of ~1.26 million, suggesting strong market participation. This surge was followed by a sharp rejection, indicating sellers are actively defending higher price levels.
1-Hour Support/Resistance and Candlestick Patterns
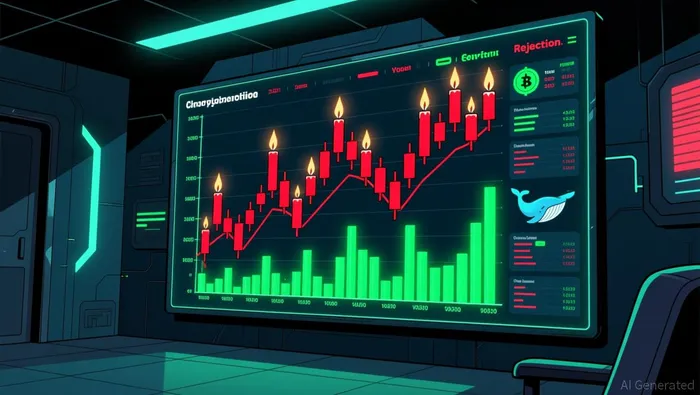
Price action reveals a clear battle between buyers and sellers around the 0.00190–0.00196 resistance zone. The 02:00 UTC candle formed a strong bullish move to 0.00196, but the subsequent 03:00 and 04:00 candles showed significant rejection. The 04:00 candle is particularly notable, with a high of 0.00196 and a low of 0.00166, creating a long upper wick that is more than twice the length of its body, signaling strong seller presence. This is confirmed by the bearish engulfing pattern observed in the 04:00 candle, where the bearish body fully covers the prior bullish candle’s body. Additionally, the 05:00 candle closed lower at 0.00171, reinforcing the rejection. The price is currently closer to the 0.00170 support level, which was tested as the low of the 05:00 candle. If this support breaks, the next key support is 0.00166, while resistance remains firmly at 0.00190 and 0.00196.
Volume and Turnover vs. Historical Comparison
The 24-hour volume profile shows distinct anomalies compared to historical averages. The average 7-day daily volume is approximately 30.2 million NOM, while the 15-day average is 31.5 million NOM. The 7-day average hourly volume is 1.26 million NOM. Hours with volume exceeding twice this average (i.e., >2.52 million) are critical for analysis. The 02:00 UTC candle recorded a volume of 32.98 million NOM, which is approximately 26 times the 7-day average hourly volume. The 04:00 UTC candle recorded 29.86 million NOM, roughly 23 times the average. These massive volume spikes were followed by price reversals. Specifically, the 02:00 spike led to a high of 0.00196 but failed to sustain, closing lower. The 04:00 spike resulted in a sharp drop from 0.00191 to 0.00183, and further down to 0.00171 in the next hour. This indicates that the high volume did not drive sustainable price appreciation but rather facilitated a distribution or liquidation event. The volume anomalies appear to have triggered a strong mean reversion rather than a breakout.
Look Back: Current Market Phase
Based on the 15-day data, the market structure is characterized by higher highs and higher lows, indicating an uptrend. The 3-day price change is +11.76% and the 7-day change is +18.75%, which are significant upward moves. However, the recent sharp rejection from 0.00196 suggests a potential short-term correction within the broader uptrend. The price has not yet formed a lower high, so the uptrend structure remains intact. Nevertheless, the extreme volatility and volume spikes suggest that the market is in a high-volatility uptrend phase, possibly approaching a local top. If the price fails to reclaim 0.00190, the market could transition into a sideways consolidation or a short-term downtrend to test lower supports. The current phase appears to be a profit-taking correction within a larger bullish structure.
For the next 24 hours, the market appears likely to consolidate between 0.00166 and 0.00180. Upside risk emerges if price breaks above 0.00180 with volume, targeting 0.00190. Downside risk increases if price breaks below 0.00166, potentially leading to a retest of 0.00150. Traders should monitor volume for signs of renewed buying pressure or further selling exhaustion.

Decoding market patterns and unlocking profitable trading strategies in the crypto space
Latest Articles
Stay ahead of the market.
Get curated U.S. market news, insights and key dates delivered to your inbox.


AInvest
PRO
AInvest
PRO




Comments
No comments yet