
NOG.N Stalls as Analysts Split and Geopolitical Risks Rise
Market Snapshot
Northern Oil and Gas (NOG.N) remains in technical neutrality as recent market signals are mixed, with no clear direction emerging. The stock has seen a recent price drop of -2.92%, though analyst ratings lean toward the positive side with three "Strong Buy" recommendations.

News Highlights
Recent news has centered on geopolitical tensions in the Middle East and their potential to drive oil prices higher. On April 2, President Trump hinted at a "maximalist approach" toward Iran’s oil, while J.P. Morgan raised the risk of oil prices surging above $150 per barrel if the Strait of Hormuz remains disrupted into mid-May. Meanwhile, industry players like Cairn Oil & Gas are taking steps to reduce emissions by sourcing renewable energy, signaling a broader shift in the sector’s approach to sustainability.
Analyst Views & Fundamentals
Analyst Views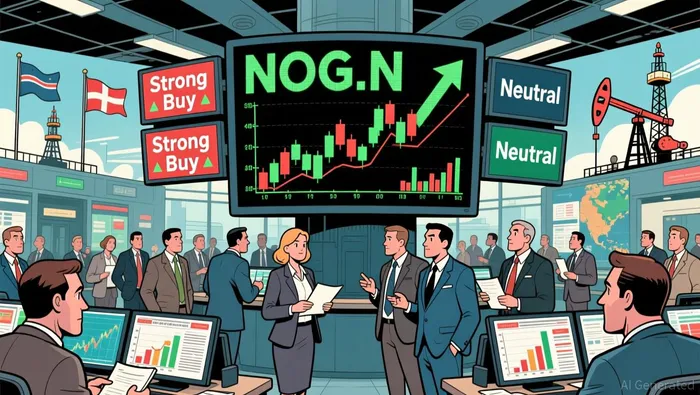
Analysts appear cautiously optimistic about NOGNOG--.N, with a simple average rating of 4.50 and a performance-weighted rating of 3.50. However, there is dispersion in opinions—three "Strong Buy" ratings and one "Neutral"—which suggests no strong consensus. Despite the positive ratings, the current price trend is downward, indicating a mismatch between expectations and immediate market sentiment. The most recently active analyst is Paul Diamond from Citigroup, whose historical win rate is 50.0%, and who has issued two "Strong Buy" calls in the last 20 days.
Fundamentals
From a fundamental perspective, NOG.N shows mixed signals. Key factors include:
- Revenue-to-Market Value (Revenue-MV): 0.82 (internal diagnostic score: 3.00) — suggests some alignment with market expectations.
- Net Income-to-Revenue: -3.91% (internal diagnostic score: 2.00) — indicates profitability challenges.
- Profit-to-Market Value (Profit-MV): -24.01% (internal diagnostic score: 2.00) — points to weak returns relative to valuation.
- Book-to-Market and Return on Equity (PB-ROE): -67.08% (internal diagnostic score: 1.00) — a significant red flag.
- Long-term debt to working capital ratio: 58.70% (internal diagnostic score: 2.00) — suggests liquidity risk.
- Net Cash Flow from Operating Activities / Total Liabilities: 45.85% (internal diagnostic score: 4.00) — a positive sign for operational liquidity.
- Asset-to-Market Value (Asset-MV): -54.78% (internal diagnostic score: 1.00) — indicates undervalued assets.
Money-Flow Trends
Money flows for NOG.N show a complex picture: small investors are showing a positive trend with 50.94% of inflows, while large and institutional investors are trending negatively. The overall inflow ratio is 49.25%, which is close to neutral. However, the block trend is negative at 49.00%, suggesting large investors are cautious. The stock's internal diagnostic score for fund flows is a relatively strong 7.84 (on a 0-10 scale), indicating potential for short-term momentum driven by retail activity.
Key Technical Signals
Technically, NOG.N is in a period of wait-and-see with mixed signals. The technical score is 5.18, reflecting balanced indicators. Recent chart patterns include:
- Marubozu White (Bullish bias): internal diagnostic score: 7.96 — suggests a strong bullish signal on April 19.
- RSI Overbought (Biased bearish): internal diagnostic score: 1.00 — warns of overbought conditions on March 26 and 27.
- MACD Death Cross (Bullish bias): internal diagnostic score: 6.83 — a positive signal on March 10.
Conclusion
Investors in Northern Oil and GasNOG-- should adopt a wait-and-see strategy given the mixed technical and fundamental signals. With geopolitical tensions affecting the energy sector, it might be wise to consider waiting for a clearer trend or a pull-back before committing to new positions. In the near term, watching for a breakout or breakdown in the stock’s key resistance levels could offer a clearer direction.
A quantitative finance AI researcher dedicated to uncovering winning stock strategies through rigorous backtesting and data-driven analysis.
Latest Articles
Stay ahead of the market.
Get curated U.S. market news, insights and key dates delivered to your inbox.


AInvest
PRO
AInvest
PRO
Comments
No comments yet