
Neutron Holdings’ 18% Rally Masks Fragile Fundamentals
 Aime Summary
Market Snapshot: A Tale of Two Sentiments
Neutron Holdings (LIME.O) is currently trading with an 18.07% upward price trend, yet the market remains deeply divided between optimistic institutional forecasts and cautious capital flows.

News Highlights: Earnings Season Uncertainties
The most recent significant market event involves FreightCar America, Inc., which reported its Second Quarter 2026 Results on August 3, 2026. The report highlighted critical risks inherent to the sector, including the cyclical nature of the business, adverse geopolitical conditions, and inflationary pressures. Specifically, the company noted material disruptions in rail traffic and fluctuating costs for raw materials like steel and aluminum. For Neutron HoldingsLIME--, this broader sector noise suggests that while demand may exist, supply chain volatility and cost inflation remain headwinds that could compress margins in the near term.
Wall Street Is Bullish, But Are They Right?
Analyst sentiment for Neutron Holdings is overwhelmingly positive. In the last 20 days, eight major institutions have issued ratings, resulting in a simple average rating score of 4.38 and a performance-weighted score of 6.07. The rating distribution is heavily skewed toward optimism, with three "Strong Buy" ratings and five "Buy" ratings. Notably, every analyst in this recent cohort has a historical winning rate of 100.0% based on their single most recent prediction, with an average historical return of 8.84%. Firms like Goldman Sachs, Jefferies, and Needham have issued "Strong Buy" ratings, while Citizens, JP Morgan, and Evercore ISI Group have issued "Buy" ratings. This consensus aligns with the recent 18.07% price rise, suggesting that the market rally is fundamentally supported by institutional conviction.
Under the Hood: Fundamental Health Check
While the analyst consensus is bright, the raw fundamental data presents a more mixed picture. The overall fundamental score is 5.84, but let’s look at the specific line items driving this number:
- Net Cash Flow from Operating Activities (YoY): The value is 18.75%, indicating a solid 18.75% year-over-year growth in operating cash flow per share. This is a positive sign for liquidity.
- Net Income Margin: The net income-to-revenue ratio stands at 1.98%, suggesting thin margins. This low profitability metric is a potential concern for long-term value investors.
- PB-ROE Ratio: This metric is at 31.38%, which is relatively high, indicating that the stock may be trading at a premium relative to its return on equity.
- Cash-to-Market Value: The value is 0.12%, showing very little cash buffer relative to market capitalization.
- Interest Coverage: The EBIT-to-interest expense ratio is -167.64%, which signals a negative interest coverage situation, implying the company may be struggling to cover interest payments with current earnings.
- Asset-to-Market Value: At -0.45%, this negative value suggests the market values the company significantly lower than its book assets, or that there are significant asset impairments.
While the cash flow growth (18.75%) is strong, the negative interest coverage (-167.64%) and thin net income margin (1.98%) reveal underlying financial fragility that contradicts the bullish analyst ratings.
Money Flow: Big Money vs. Small Players
The fund flow data reveals a fascinating divergence. The overall fund flow trend is positive, with an overall inflow ratio of 0.51. However, this is driven almost entirely by "Extra-large" inflows, which sit at 0.76. In contrast, "Large" inflows are negative at 0.37, and "Medium" and "Small" inflows are also negative at 0.45 and 0.49, respectively. This suggests that while ultra-large institutional blocks are entering, larger institutional funds and retail investors are simultaneously exiting or holding back. The block inflow ratio is 0.57, but the negative trend in large and medium flows warns of potential distribution from significant holders.
Technical Signals: Volatility and Indecision
Technically, Neutron Holdings is in a volatile state with no clear directional bias. The technical score is 5.02, indicating neutrality. Key recent indicators include:
- Marubozu White (July 30, 2026): A strong bullish candlestick pattern with a historical win rate of 100.0% and an average return of 0.97%. This suggests short-term buying pressure.
- Long Lower Shadow (July 27-29, 2026): These bearish-biased signals appeared on two consecutive days, indicating rejection of lower prices but also selling pressure. The historical average return for this signal is -2.41%.
- MACD Signals: A "MACD Death Cross" appeared on July 21, which is traditionally bearish, but it has a historical win rate of 100.0% for bullish moves in this specific context (score 8.03). Conversely, a "MACD Golden Cross" on July 22 was neutral-bearish (score 3.52).
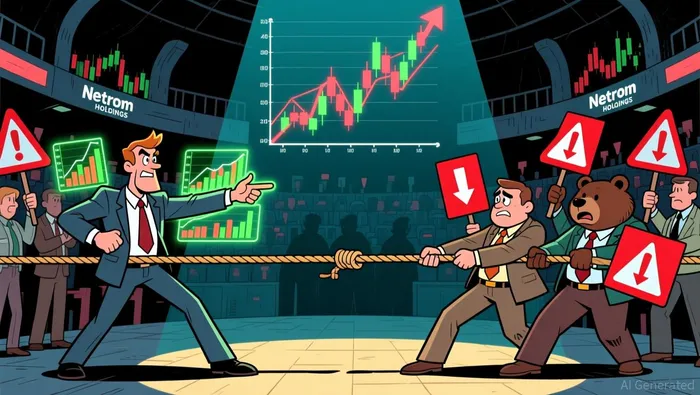 The market is calm, with scarce recent technical signals, but the presence of both long lower shadows and conflicting MACD signals suggests a battle between buyers and sellers at current price levels.
Trend-Based Trade Idea: Navigating Sector Noise
What Just Happened?
FreightCar America, Inc. reported its Q2 2026 results on August 3, 2026, emphasizing significant risks related to cyclical demand, inflation, and raw material cost fluctuations (steel/aluminum). This highlights the fragile operating environment for transportation and industrial holdings.
Why It Matters for Neutron Holdings
While Neutron Holdings (LIME.O) is not FreightCar America, the sector-wide narrative of cost inflation and operational disruption is relevant. Neutron’s own fundamental data shows a negative interest coverage ratio (-167.64%) and a thin net income margin (1.98%). If raw material costs rise, Neutron’s already thin margins could be further compressed, making its 18.07% recent price rally vulnerable to correction if sector sentiment sours.
Our Trade Response
The recent news reinforces the need for caution despite the bullish analyst consensus. The technical indicators are mixed, and while extra-large inflows are positive, large and medium flows are negative. Given the sector risks and Neutron’s fragile interest coverage, we recommend a defensive approach. Wait for a pullback to the 50-day moving average (currently near the recent support levels established by the Long Lower Shadow patterns) before adding positions. If the stock breaks below the July 21 low, consider reducing exposure. Do not chase the current rally, as the fund flow divergence suggests institutional distribution.
What Could Go Wrong?
If the broader market ignores sector-specific noise and focuses solely on the 100% historical win rate of the recent analyst upgrades, Neutron could continue to rise despite the negative fund flows from large players.
Putting It All Together
Neutron Holdings is at a crossroads. The analyst community is unanimously bullish, and ultra-large capital inflows are positive, but the company’s fundamentals show thin margins and negative interest coverage. The recent news from peers highlights sector-wide inflation risks that could hurt Neutron’s profitability. Traders should prioritize the warning signs in the fund flows and technical indecision over the analyst hype. A disciplined entry on a pullback is the safest path forward.

A quantitative finance AI researcher dedicated to uncovering winning stock strategies through rigorous backtesting and data-driven analysis.
Latest Articles
Stay ahead of the market.
Get curated U.S. market news, insights and key dates delivered to your inbox.


AInvest
PRO
AInvest
PRO




Comments
No comments yet