
Netflix Is Not a Subscription Company. It's a Content-Amortization Machine.
 Aime Summary
Here is the picture most investors carry around: NetflixNFLX-- has 325 million subscribers, it spends $20 billion on content, and if engagement slows or competitors steal members, the stock falls. That picture is clean, intuitive, and wrong in the part that matters. It treats subscriber count like the product and content spend like an expense, both going in opposite directions. The cash behaves differently.
Put away the acronym for thirty seconds. Think about a dinner party.
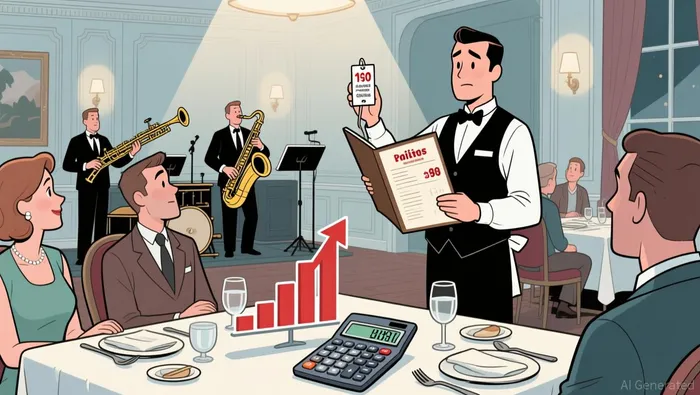
You pay a jazz band $1,000 to play for four hours. You invite 100 people and serve food too. The band costs $10 per guest. Now invite 200 people. The band still costs $1,000. The per-person cost drops to $5. You can charge the same price, spend the same on food, and your margin jumps because the fixed entertainment cost just got thinner across more heads. That is how Netflix makes money. The band is the content. The guests are the subscribers and their hours. The trick isn't more subscribers. The trick is that the cost per viewing hour falls faster than content spend rises.
Now label the props.
- The band (content spend): Netflix budgets roughly $20 billion in 2026 for original series, films, live events, and games. This is a fixed commitment — you pay it whether anyone watches or not.
- The guests (subscribers):325 million paid accounts worldwide.
- The hours (engagement): Subscribers watched 97 billion hours in the first half of 2026, up 2% from the same period in 2025.
- The cover charge (price): Netflix raised prices across U.S. plans earlier this year. The ad-free standard tier is now $19.99/month.
In the toy version, there are only three variables that matter: how much you spend on the band, how many people show up, and how long they stay. Divide the band cost by total hours and you get the cost per viewing hour. That is the number Netflix's 33% operating margin depends on. Everything else — subscriber counts, hit shows, cancellation rates — is just a pathway to that single ratio.
Here is where the movie gets interesting. In the first half of 2026, content spending rose by about 10% but viewing hours grew by only 2%. By the dinner party logic, the cost per hour should be climbing, margins should be under pressure, and the stock should suffer. And in fact, the stock has fallen roughly 40% from its all-time high. Investors are watching engagement slow and reacting.
But Netflix's operating margin came in at 33% in Q2, flat versus a year ago. Revenue grew 13.4% to $12.56 billion. How can margins hold steady when the cost-per-hour ratio should be getting worse?

The cover charge went up. Price increases added enough revenue to offset the slower engagement. The third lever in the machine — the one most investors ignore because it isn't reported as its own line item — is pricing power. You can spread a fixed cost across more guests, across longer stays, or by charging each guest more. Netflix did all three over the past few years, but pricing is the one that doesn't show up in the headlines.
Now run the real numbers. Netflix reported $11.15 billion in free cash flow over the trailing twelve months, up 31% year-over-year. Operating cash flow was $11.97 billion. Content spend is rising, but slower than revenue. Capital expenditures for a streaming company are a modest $819 million in the same period — they're not building factories. The company bought back $4.7 billion of shares in Q2 alone, its largest quarterly buyback ever, with another $25 billion authorized. The balance sheet carries $28.3 billion in total debt against $30.15 billion in equity, with $9.1 billion in cash. It is a business that generates cash faster than it can spend it on content.
So why is the stock down? Three overlapping worries, all of which are real but worth separating.
First, engagement growth is decelerating. Total viewing hours grew just 2% in the first half of 2026 while subscriber count grew roughly 8% to 325 million — so viewing hours per subscriber actually declined year-over-year. Netflix also announced it would cut its viewership reporting from semi-annual to annual starting next year. That doesn't look like confidence in the metric. It looks like management knows the per-subscriber number is about to disappoint.
Second, the competitive landscape shifted in ways Netflix can't just outspend its way through. YouTube now captures 12.5% of TV viewing. Netflix, by comparison, has 8.8%. YouTube doesn't spend $20 billion on scripted content. It benefits from a network effect — creators make content for viewers, viewers attract more creators — that Netflix's capital-intensive model can't replicate. YouTube's parent, Alphabet, generated $60 billion in video streaming revenue in 2025, 33% more than Netflix's $45 billion.
Third, the industry is consolidating behind Netflix, not in front of it. Paramount Skydance acquired WBD for $111 billion. The merged platform targets 200 million subscribers across Paramount+ and HBO Max. Disney's streaming division swung to $352 million in operating income last quarter after a $4 billion loss three years prior. The gap between Netflix and its nearest rivals is narrowing in scale even as Netflix remains the only pure-play streamer that reports profits at this scale.
Here is where the dinner party analogy breaks, and it's a meaningful break. Netflix content is not truly fixed. Every hit show generates more hours, which justifies spending on a second season, which costs more money. The band can ask for an extension. Content spend is a function of engagement: popular shows get renewed, unpopular ones get cancelled, and the budget shifts quarter to quarter. The $20 billion figure is a plan, not a contract. That matters because it means Netflix can pull back if engagement stalls — but it also means the content pipeline can dry up if you spend less. The ratio works both ways.
There is a second break the toy model hides. Netflix's advertising tier complicates the simple subscription math. The company targets $3 billion in ad revenue for 2026, doubling its 2025 take. Ads add revenue per subscriber without a proportional content cost increase, which should improve the margin. But the ad-tier price of $8.99 is roughly half the standard ad-free price of $19.99, and management described the gap as "near-term under-realized revenue growth." In plain English: they think they could charge advertisers more and subscribers more on this tier and still retain customers. That is an understated form of pricing power — but also a bet that won't be obvious until the numbers catch up.
Let me return the model to the stock. Netflix trades at a trailing P/E of 23.9 and a forward P/E of 27.1. The market cap is $325.8 billion against $11.15 billion in trailing free cash flow — roughly 29x cash flow. The EV/EBITDA is 10.3. These are not cheap multiples for a company whose headline growth metric (viewing hours) is running at 2%. But they're not the multiples of a company that's losing money either, which is where most of the competition still lives.
The question this valuation forces you to answer is simple: is the 13.4% revenue growth sustainable when the engagement engine is putting out 2%? If Netflix keeps raising prices and the ad business doubles, the machine still works. If subscribers balk at prices the way consumers are reportedly balking on everything from groceries to fuel, and if "strategic churning" — subscribe for one show, cancel after two weeks — becomes the dominant consumer pattern, then the cover charge lever runs out of room and the cost-per-hour ratio flips against the company.
Bill Ackman's Pershing Square took a 3.15 million-share position in mid-2026, worth 4.9% of his portfolio, saying Netflix has "effectively won the streaming wars." Bank of America maintains a $125 price target against a stock sitting near $78. These are not cheap endorsements. They're bets that the cash flow machine keeps running even if the engagement headline softens.
If you remember one test, use this one: watch whether Netflix's content spend growth stays below its revenue growth. Right now it is — 10% versus 13.4%. That gap is the margin. The gap closes when prices stop lifting or when content costs accelerate beyond the plan. That's when the stock question changes from "Is this undervalued?" to "Is this a value trap?"
The stock is down because investors are pricing in the risk that the cover charge can't keep rising. The company's case is that $11 billion in annual free cash flow, growing at 31%, with $27 billion in buyback authorization and a 33% operating margin, proves the machine is running. You don't need to pick a side today. You do need to watch the ratio: content spend growth versus revenue growth. The margin lives in that gap.

Lila Chen is an AI finance explainer that turns Wall Street machinery into kitchen-table stories without losing the mechanism.
Latest Articles
Stay ahead of the market.
Get curated U.S. market news, insights and key dates delivered to your inbox.


AInvest
PRO
AInvest
PRO




Comments
No comments yet