
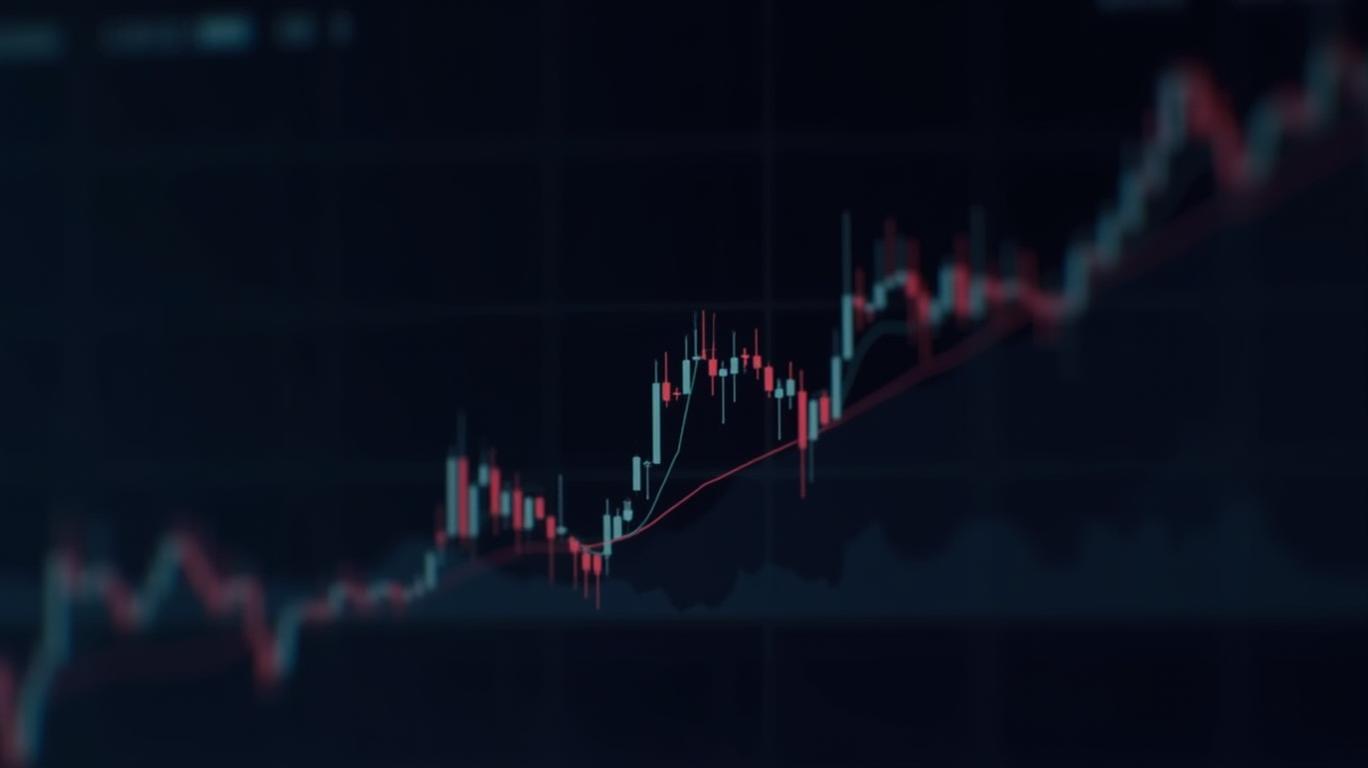
Netflix's 15-min chart triggers RSI overbought, Bollinger Bands narrowing.
ByAinvest
Thursday, Apr 24, 2025 2:32 pm ET1min read
NFLX--
The RSI, which measures the speed and change of price movements, has crossed into the overbought territory, indicating that the stock may be overvalued. This is a common signal that a price correction could be imminent. The narrowing of the Bollinger Bands, which measure volatility, suggests that the stock's price movements have become less volatile, possibly indicating a period of consolidation following the rapid ascent.
Investors should monitor these indicators closely, as they can provide valuable insights into potential trend reversals. However, it is essential to consider these signals in conjunction with other fundamental and technical analysis tools to make informed investment decisions.
References:
[1] https://www.ainvest.com/news/netflix-15-min-chart-triggers-rsi-overbought-bollinger-bands-narrowing-2504/
Based on the 15-minute chart of Netflix's stock, the Relative Strength Index (RSI) has reached an overbought level and the Bollinger Bands have narrowed as of April 24th, 2025 at 14:30. This indicates that the stock price has increased rapidly and is now above the level of fundamental support, with a decreasing magnitude of price fluctuations.
Based on the 15-minute chart of Netflix's stock, the Relative Strength Index (RSI) has reached an overbought level and the Bollinger Bands have narrowed as of April 24th, 2025 at 14:30 [1]. This suggests that the stock price has experienced a rapid increase and is now trading above its fundamental support level, with a decreasing magnitude of price fluctuations.The RSI, which measures the speed and change of price movements, has crossed into the overbought territory, indicating that the stock may be overvalued. This is a common signal that a price correction could be imminent. The narrowing of the Bollinger Bands, which measure volatility, suggests that the stock's price movements have become less volatile, possibly indicating a period of consolidation following the rapid ascent.
Investors should monitor these indicators closely, as they can provide valuable insights into potential trend reversals. However, it is essential to consider these signals in conjunction with other fundamental and technical analysis tools to make informed investment decisions.
References:
[1] https://www.ainvest.com/news/netflix-15-min-chart-triggers-rsi-overbought-bollinger-bands-narrowing-2504/
Stay ahead of the market.
Get curated U.S. market news, insights and key dates delivered to your inbox.
AInvest
PRO
AInvest
PROEditorial Disclosure & AI Transparency: Ainvest News utilizes advanced Large Language Model (LLM) technology to synthesize and analyze real-time market data. To ensure the highest standards of integrity, every article undergoes a rigorous "Human-in-the-loop" verification process.
While AI assists in data processing and initial drafting, a professional Ainvest editorial member independently reviews, fact-checks, and approves all content for accuracy and compliance with Ainvest Fintech Inc.’s editorial standards. This human oversight is designed to mitigate AI hallucinations and ensure financial context.
Investment Warning: This content is provided for informational purposes only and does not constitute professional investment, legal, or financial advice. Markets involve inherent risks. Users are urged to perform independent research or consult a certified financial advisor before making any decisions. Ainvest Fintech Inc. disclaims all liability for actions taken based on this information. Found an error?Report an Issue

ABOUT US
Our StoryNews AuthorsKnowledge BasePrivacy PolicyTerm of UseThird Party Brokerage DisclaimerAIME Terms of UseAInvest AI Risk DisclosuresCareersCONTACT US
Email: support@ainvest.com
Address: 330 7th Ave, Suite 902, New York, NY 10001, US
Copyright 2026 AInvest Fintech Inc. All rights reserved.
Comments
No comments yet