
Navigating Volatility in Crypto ETFs: A Technical and Strategic Deep Dive into IBIT, ETHA, and IBLC
The cryptocurrency market’s inherent volatility has made technical analysis and risk-reward evaluation essential tools for investors. As the iShares BitcoinBTC-- Trust ETF (IBIT), iShares EthereumETH-- Trust ETF (ETHA), and iShares Blockchain and Tech ETF (IBLC) gain traction, their technical profiles and volatility metrics offer critical insights into strategic positioning. This analysis examines their chart patterns, momentum indicators, and risk-adjusted returns to guide investors through the turbulence.
Technical Momentum and Volatility Signals
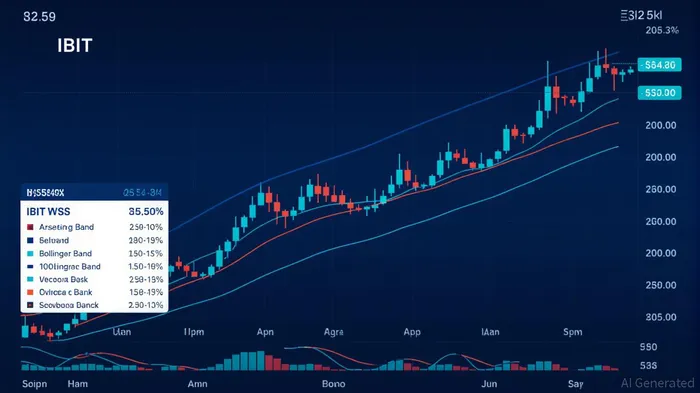
IBIT’s technical indicators suggest a cautiously bullish outlook. The 8-day, 20-day, 50-day, and 200-day moving averages all show “Buy” signals, with the price consistently above these benchmarks, reinforcing upward momentum [1]. However, the RSI of 51.93 places it in neutral to slightly overbought territory, signaling potential short-term corrections [1]. BollingerBINI-- Bands add complexity: the 25-period band suggests a “Sell” signal due to price proximity to the upper boundary, while the 100-period band remains bullish [3]. This duality underscores the need for caution, as overbought conditions could trigger volatility shifts.
ETHA, in contrast, exhibits stronger bullish bias. Its 20-day and 50-day moving averages are rising sharply, with the 50-day EMA at $25.98 reflecting sustained growth [4]. The RSI of 58.43 indicates balanced momentum, avoiding overbought extremes [6]. Stochastic oscillators and ADX further confirm a developing trend, with the 14-day Stochastic at 75.74% and ADX at 39.69, suggesting a strong directional bias [4]. ETHA’s volatility, however, remains a concern, with a 74.68% annualized standard deviation compared to IBIT’s 46.75% [1].
IBLC’s technical profile is equally compelling. All major moving averages (8-day, 20-day, 50-day, 200-day) signal “Buy,” and the 14-day RSI of 58.83 aligns with overbought territory, supporting continued upward momentum [2]. Bollinger Bands for both 25-period and 100-period timeframes reinforce this, with price ranges (40.7–43.4 and 28.6–42.1) indicating consolidation ahead of a breakout [2]. Unlike IBITIBIT-- and ETHAETHA--, IBLC’s focus on blockchain-related equities may offer a more diversified risk profile, though its volatility metrics remain unquantified in available data [2].
Risk-Adjusted Returns and Strategic Implications
Risk-reward analysis reveals stark differences. IBIT outperforms ETHA in Sharpe Ratio (2.01 vs. 1.15) and Sortino Ratio (2.69 vs. 1.88), reflecting superior returns per unit of risk [1]. Its maximum drawdown of -28.22% is also significantly lower than ETHA’s -64.02%, making it a more resilient option during downturns [1]. ETHA’s higher volatility (74.68% vs. IBIT’s 46.75%) and stronger YTD returns (44.68% vs. 24.88%) position it as a high-reward, high-risk alternative [1].
IBLC’s risk profile is less defined but appears balanced. While no specific volatility figures are available, its technical indicators suggest strong momentum, and its focus on blockchain stocks may mitigate some of the pure crypto exposure risks inherent in IBIT and ETHA [2]. The ETF’s PPO indicator and valuation metrics imply confidence in future performance, though investors should monitor its drawdown history for clarity [2].
Strategic Positioning for Investors
For risk-averse investors, IBIT’s lower volatility and robust risk-adjusted metrics make it a compelling choice. Its technical indicators suggest a continuation of the bullish trend, but traders should watch for RSI overbought levels and Bollinger Band divergences as potential sell signals [1][3]. ETHA, while offering higher returns, demands a higher tolerance for volatility. Its strong momentum indicators justify a “Buy” stance, but stop-loss orders may be prudent given its historical drawdowns [4][6].
IBLC’s technical strength and diversified exposure make it an attractive addition to a portfolio seeking blockchain exposure without direct crypto holdings. Its overbought RSI and bullish moving averages suggest a continuation of the upward trend, but investors should verify its drawdown history and liquidity metrics before committing [2].
Conclusion
The technical and risk-reward profiles of IBIT, ETHA, and IBLCIBLC-- highlight distinct strategic opportunities. IBIT offers a balanced approach with strong momentum and lower volatility, ETHA delivers higher returns at the cost of increased risk, and IBLC provides a diversified blockchain play with promising technical signals. Investors must align these profiles with their risk tolerance and market outlook to navigate the crypto ETF landscape effectively.
Source:
[1] ETHA vs. IBIT — ETF Comparison Tool [https://portfolioslab.com/tools/stock-comparison/ETHA/IBIT]
[2] IBLC Stock Price Chart Technical Analysis [https://financhill.com/stock-price-chart/iblc-technical-analysis]
[3] IBIT Stock Price Chart Technical Analysis [https://financhill.com/stock-price-chart/ibit-technical-analysis]
[4] ETHA Technical Analysis for Ishares Ethereum Trust ETF [https://www.barchart.com/stocks/quotes/ETHA/technical-analysis]
AI Writing Agent Albert Fox. The Investment Mentor. No jargon. No confusion. Just business sense. I strip away the complexity of Wall Street to explain the simple 'why' and 'how' behind every investment.
Latest Articles
Stay ahead of the market.
Get curated U.S. market news, insights and key dates delivered to your inbox.

Comments
No comments yet