
Mubarak Rebounds, But Volume Fails to Fuel Rally
 Aime Summary
Summary
- Mubarak trades near resistance with repeated bearish engulfing and long upper shadows indicating rejection.
- Volume spikes on August 1 failed to sustain upward momentum, suggesting weak buying pressure.
- Seven-day structure shows higher highs, but recent hourly candles signal potential mean reversion.
- Price action suggests consolidation with downside risk if key support levels are breached.
- Market appears to be in a corrective phase within a broader uptrend context.
Market Correction After Rally
Mubarak/USDC (MUBARAKUSDC) closed the 24-hour period at 0.01276, with a 24-hour total volume of approximately 1.85 million USDC. The asset has experienced significant volatility, characterized by sharp intraday swings and repeated rejection patterns near current price levels.
1-Hour Support/Resistance and Candlestick Patterns
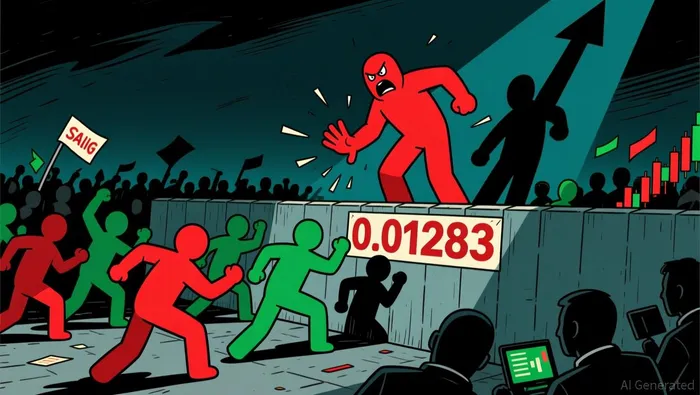
The current price action reveals a congested zone where support and resistance levels are closely intertwined. Key resistance is evident around 0.01283 and 0.01311, where the asset has faced rejection in recent hours. Specifically, the hour ending at 12:00 on August 2 saw a high of 0.01283, followed by a drop to the close of 0.01276. Another notable rejection occurred earlier, with a high of 0.01311 at 13:00 on August 1, which was followed by a sustained decline. On the support side, the level around 0.01234 has acted as a floor, with the price bouncing from lows of 0.01234 on August 2 at 10:00 and 01:00 on August 1. Candlestick patterns provide further insight into the market sentiment. A bearish engulfing pattern was identified at 14:00 on August 1 and 23:00 on August 1, indicating strong selling pressure that overwhelmed prior bullish momentum. Additionally, the hour at 09:00 on August 2 also displayed a bearish engulfing pattern. The presence of long upper shadows at 08:00 and 11:00 on August 2 suggests that buyers attempted to push prices higher but were met with significant resistance, resulting in wicks that extend well above the candle bodies. The doji pattern observed at 11:00 on August 2 further highlights indecision in the market. Given the recent rejections at higher levels and the current price trading closer to the mid-range of the recent 24-hour band, the asset appears to be nearer to resistance than support, with the immediate vicinity of 0.01283 acting as a formidable barrier.
Volume and Turnover vs. Historical Comparison
Analyzing the volume data reveals significant deviations from historical norms. The 24-hour total volume of approximately 1.85 million USDC is notably lower than the 7-day average daily volume of roughly 3.98 million USDC and the 15-day average of 2.50 million USDC. This suggests that the recent price movements have occurred with relatively diminished participation compared to the weekly average. However, specific hours exhibited volume spikes. The hour ending at 16:00 on August 1 recorded a volume of 620,830 USDC, which is significantly higher than the 7-day average single-hour volume of approximately 166,009 USDC. This spike was followed by a price decline from 0.01251 to 0.01207 in the subsequent hours, indicating that the volume did not support upward momentum. Another notable volume increase occurred at 07:00 on August 2 with 286,001 USDC, yet the price only moved modestly from 0.01240 to 0.01254. The hour at 11:00 on August 2 also saw elevated volume of 290,564 USDC, but the price action remained choppy, closing near the open. These instances of high volume without significant follow-through price movement suggest that the volume anomalies did not effectively drive the price in a sustained direction. Instead, they appear to reflect periods of increased trading activity that were absorbed by opposing forces, leading to consolidation or reversal rather than trend continuation.
Look Back: Current Market Phase
Reviewing the broader market structure over the past 7 to 15 days provides context for the current price action. The 7-day price change indicates a substantial increase of approximately 21.76%, while the 3-day change is a more modest 1.84%. The market structure feature is identified as a higher high, which typically characterizes an uptrend. However, the recent hourly price action shows a series of lower highs and lower lows within the last 24 hours, following the significant spike and rejection on August 1. This divergence between the longer-term structure and immediate price action suggests that the market may be undergoing a mean reversion phase. Given the sharp prior move and the current corrective price patterns, it appears that the asset is consolidating after a strong rally. The current phase could be interpreted as a pause or correction within a broader uptrend, where price is seeking equilibrium after the recent surge. This suggests that while the long-term structure remains bullish, the immediate momentum has shifted towards consolidation or mild downward pressure.
Looking ahead, the next 24 hours could see continued consolidation or a further pullback if support at 0.01234 fails to hold. Upside risk remains limited until the price can decisively break above 0.01283, while downside risk increases if the 0.01234 level is breached, potentially targeting lower support zones around 0.01200.

Decoding market patterns and unlocking profitable trading strategies in the crypto space
Latest Articles
Stay ahead of the market.
Get curated U.S. market news, insights and key dates delivered to your inbox.


AInvest
PRO
AInvest
PRO




Comments
No comments yet