

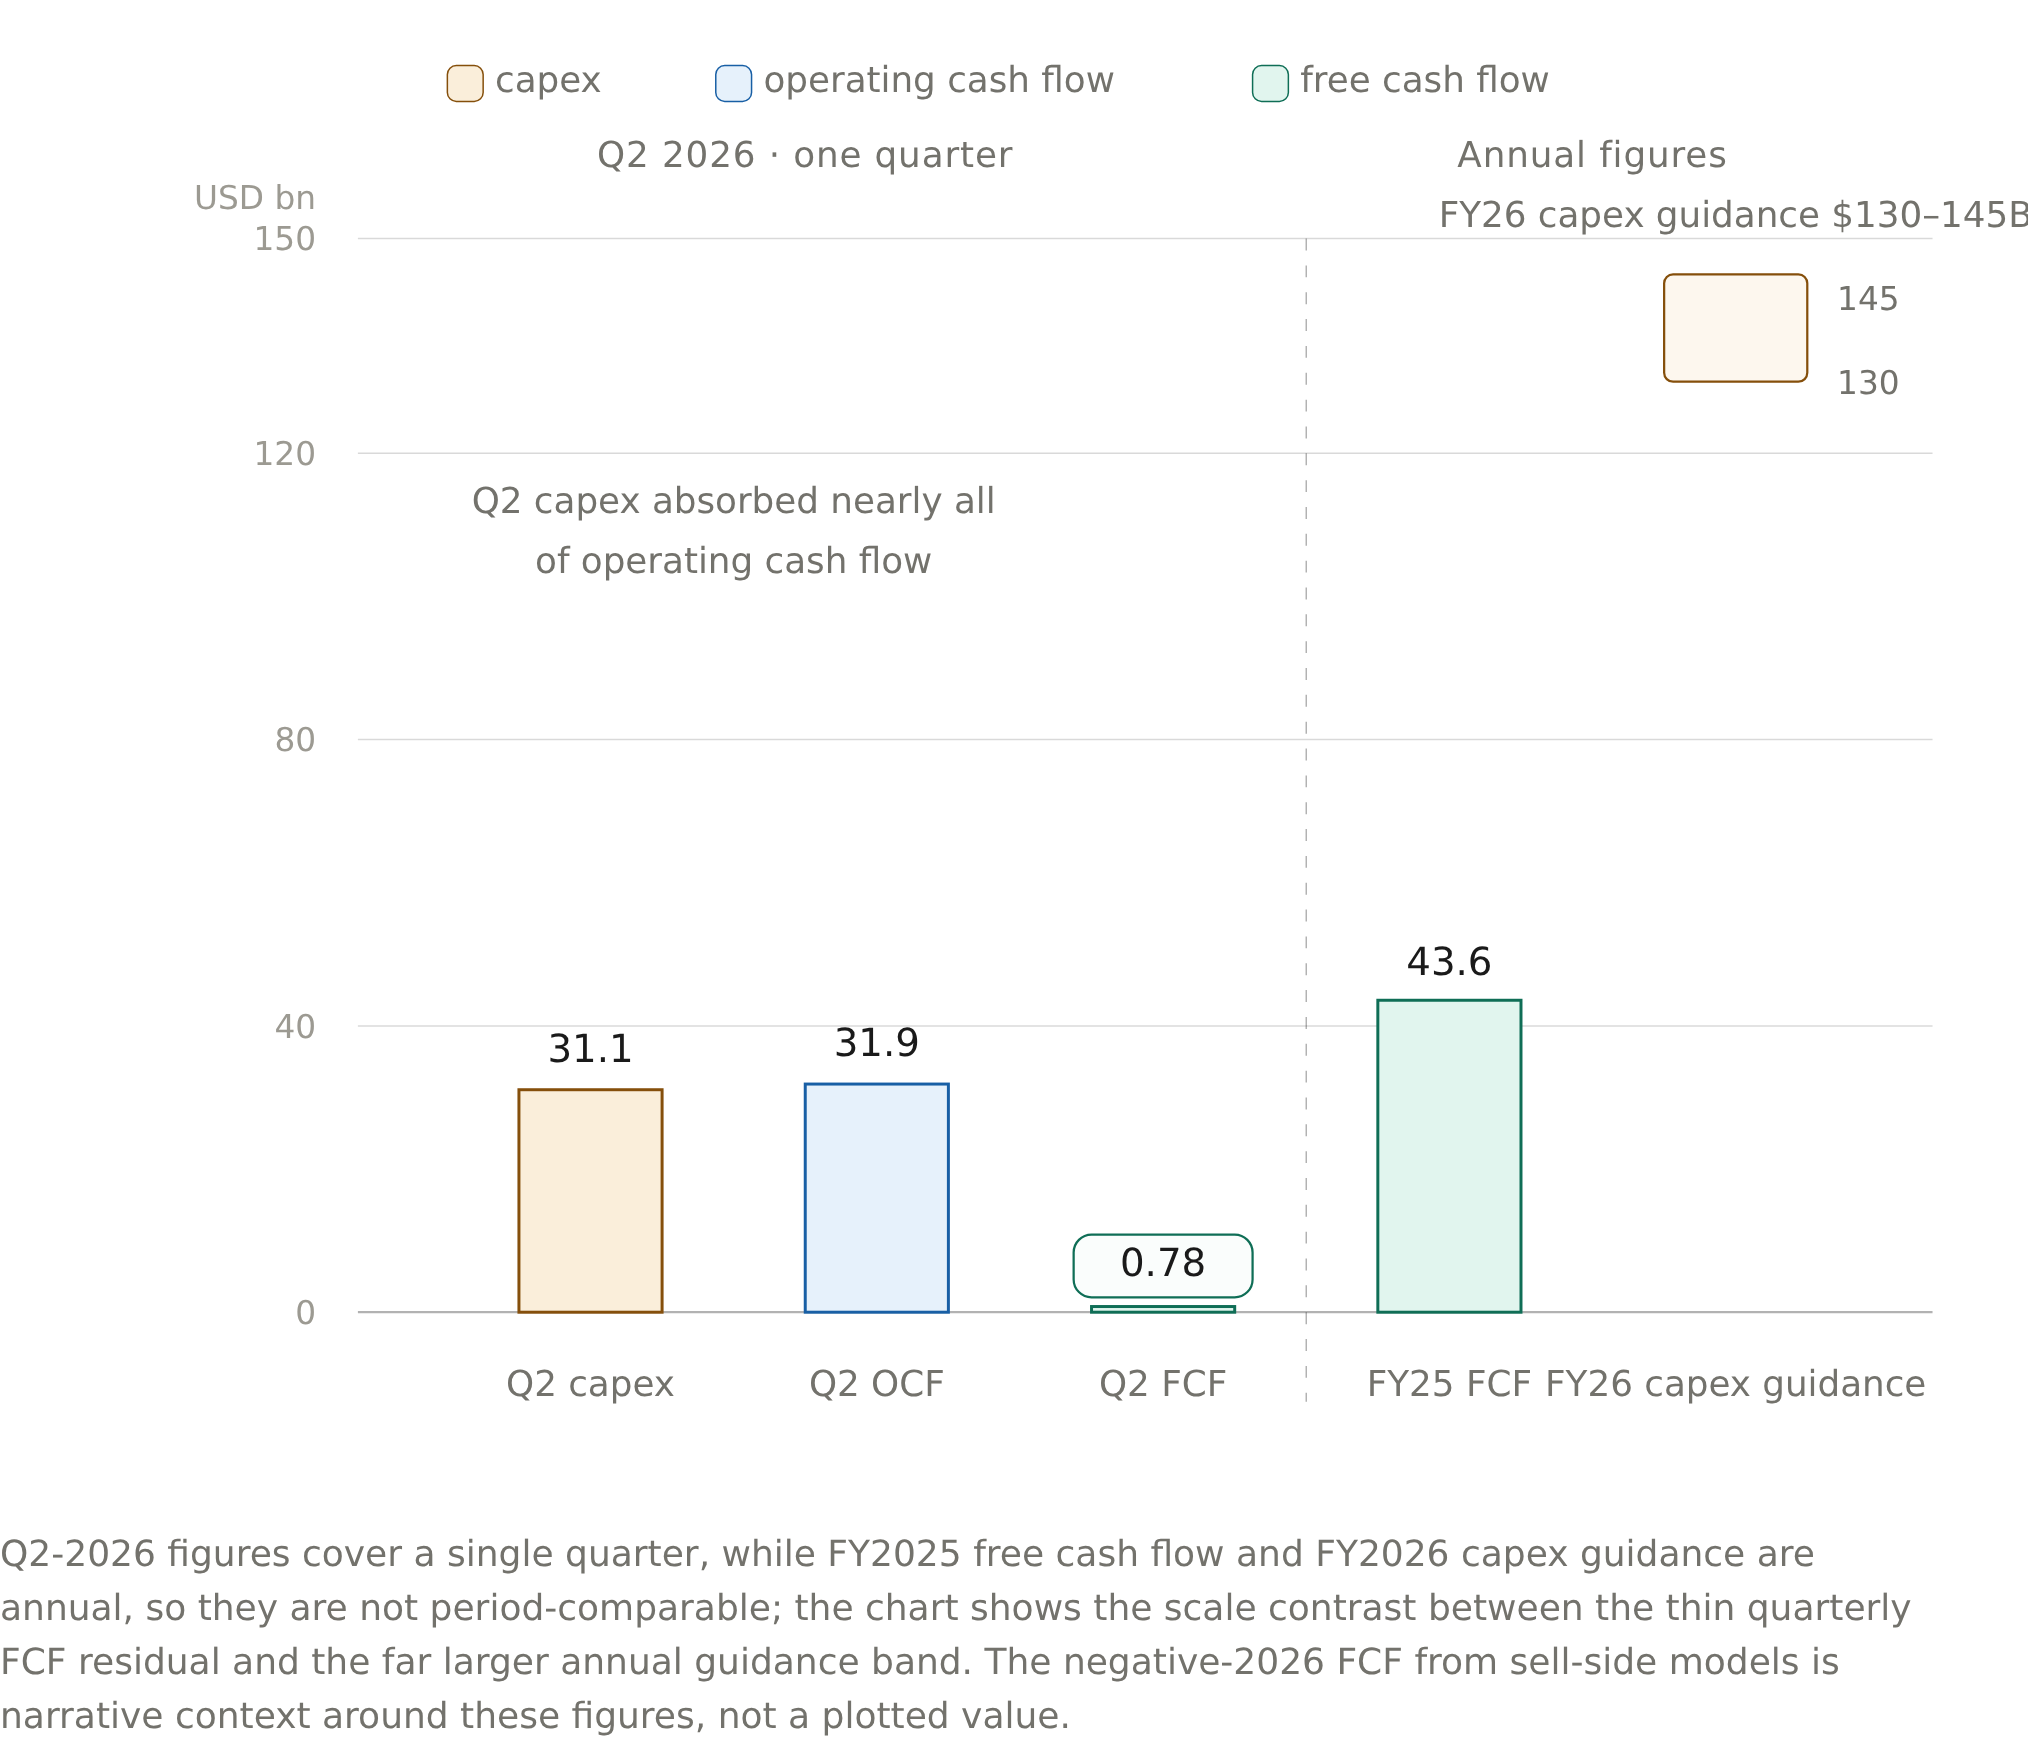
Q2-2026 figures cover a single quarter, while FY2025 free cash flow and FY2026 capex guidance are annual, so they are not period-comparable; the chart shows the scale contrast between the thin quarterly FCF residual and the far larger annual guidance band. The negative-2026 FCF from sell-side models is narrative context around these figures, not a plotted value.
| Metric | Value (USD bn) | Horizon |
|---|---|---|
| Q2-2026 capex | 31.1 | one quarter |
| Q2-2026 operating cash flow | 31.9 | one quarter |
| Q2-2026 free cash flow | 0.78 | one quarter |
| FY2025 free cash flow | 43.6 | annual |
| FY2026 capex guidance (low) | 130.0 | annual |
| FY2026 capex guidance (high) | 145.0 | annual |








Comments
No comments yet