

Meta's stock is down about 23% from its 52-week high, and here's the part that should make you stop: the quarter that knocked it down showed the company's core advertising machine running, if anything, better than expected. Advertising brought in $59.36 billion in Q2, or 97.6% of Meta's $60.80 billion in total revenue. It grew 27% from a year earlier on 14% more impressions and 12% higher pricing per ad — pricing that beat the 9% to 12% range the prediction markets had penciled in.
So why did the stock dump? Because this is a cash-flow story, not a demand story. Keeping those two apart is the whole question for anyone deciding whether to buy MetaMETA-- at a discount.
The selloff leg: a beat streak snapped on cash, not on ads
The catalyst was the Q2 print itself. Meta's $6.18 in earnings per share came in about 14% below the roughly $7.18 consensus, snapping a streak of six straight beats. The stock fell 6.63% in the following week and sat down roughly 11% for the year to date.
But look at what actually moved. The number that should stop every investor is free cash flow: $784 million in the quarter, down 91% from $8.55 billion a year earlier. That is the bear case in a single line — and it is a spending bear case, not an advertising one.
Meta is in the middle of a massive AI buildout. Q2 capital spending hit $30.12 billion, up 82.1% from a year earlier, and full-year guidance was narrowed to between $130 billion and $145 billion — roughly twice the prior year. That money is being poured on top of an advertising engine that generates essentially all of the company's revenue, so reported operating margin compressed from about 43% to about 31% in the quarter while the cash that once flowed back to shareholders now flows into data centers instead.
Read that sequence again: the earnings miss, the margin compression, and the cash-flow collapse are all downstream of a capex surge, not of lost ad demand. The feared AI disruption of the advertising business — the thing that would genuinely justify selling — is nowhere in the reported revenue mix.
The fundamental leg: a 97% advertising engine that kept compounding
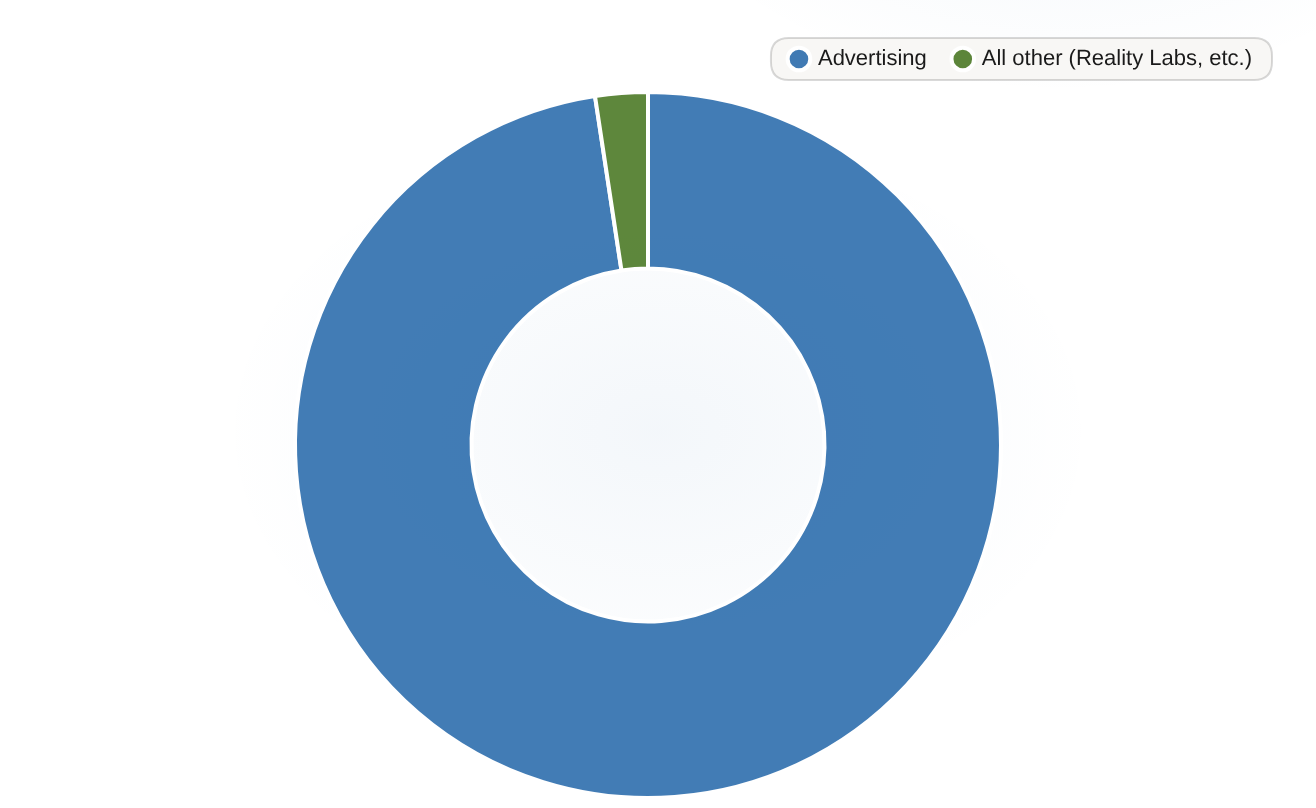
Advertising is 97.6% of Meta's Q2 2026 revenue, proving the core ad engine that powers the business remains intact despite the post-earnings drawdown.
| Segment | Share of total revenue |
|---|---|
| Advertising | 97.6 |
| All other (Reality Labs, etc.) | 2.4 |
That mix is the point. The business Meta actually runs is advertising, and in Q2 it kept right on compounding: 27% growth, driven by higher pricing rather than volume exhaustion. Weak franchises don't raise prices 12% and beat the market's own expectation. The franchise that funds the AI buildout is intact — which is exactly why the discount is being applied to capex optics, not to demand for the core engine.

What the discount is really pricing
Strip out the cash-flow optics and the valuation says the same thing. Ainvest data puts Meta's EV/EBITDA at roughly 14x — the cheapest of the Magnificent Seven — against about 23x for Alphabet, 19x for Microsoft, and 27x to 29x for Nvidia and Apple, with a forward P/E near 22x and trailing revenue growth of about 28%. For a franchise growing that fast with a trailing operating margin above 38%, that multiple is a statement about the spending cycle, not about the business.
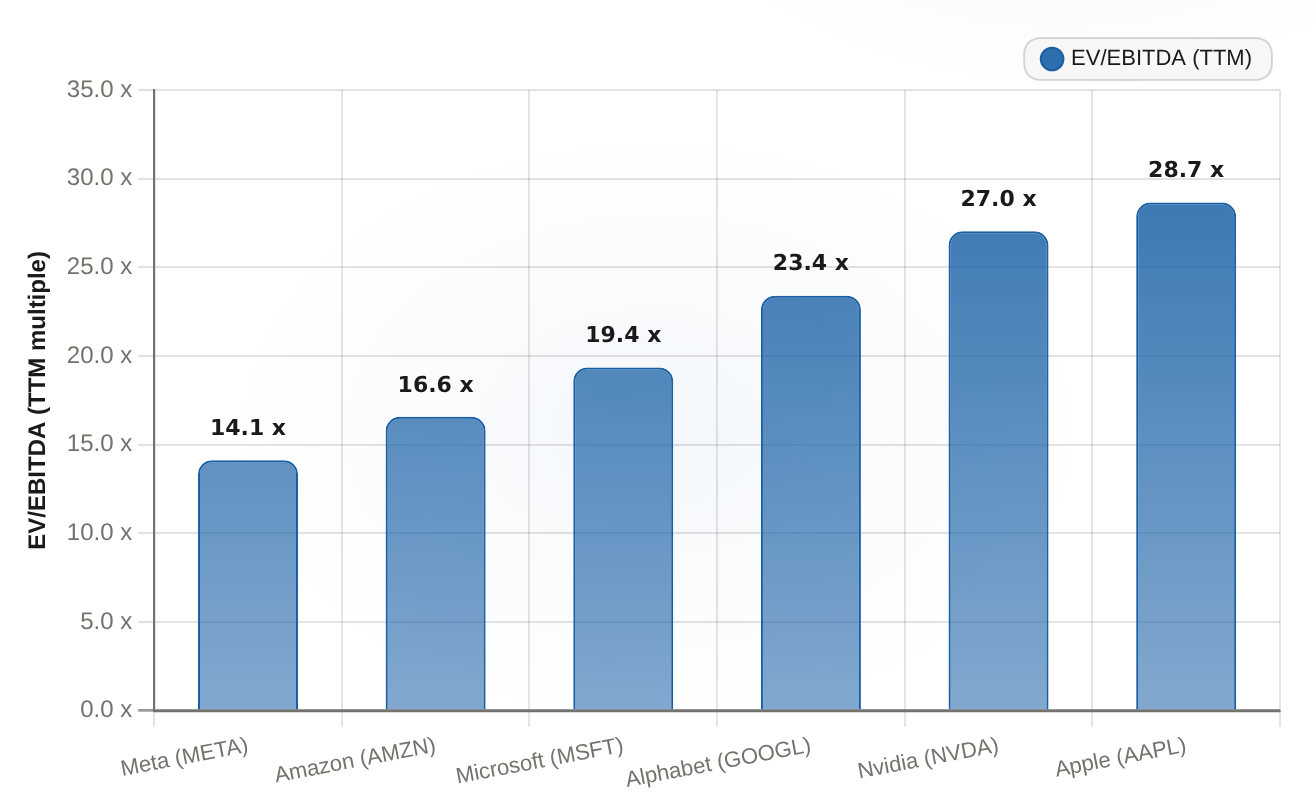
At 14.1x TTM EV/EBITDA, Meta is the least expensive of the Magnificent Seven, well below the group's richer multiples such as AAPL at 28.6x and NVDA at 27.0x.
| Company | EV/EBITDA (TTM) (x) |
|---|---|
| Meta (META) | 14.13 |
| Amazon (AMZN) | 16.57 |
| Microsoft (MSFT) | 19.36 |
| Alphabet (GOOGL) | 23.4 |
| Nvidia (NVDA) | 27.03 |
| Apple (AAPL) | 28.65 |
Here is the honest part: I can't tell you the market is wrong, only what it is pricing. Two outcomes are still live. The bull path needs capex intensity to moderate so free cash flow and operating margin recover — the kind of clean quarter that re-prices the stock. The bear path needs a break below about $520 with widening Reality Labs losses. The Q3 and Q4 reports, which have not printed, decide which one it is.
The framing for a holder or a watcher, then, is this: this is not a broken-ad-franchise reason to avoid Meta. The drawdown is engineered spending compressing free cash flow while the franchise that funds all of it keeps growing at 27%. Whether the discount closes is a question about capex discipline and the next two quarters — not about whether anyone is still clicking ads.








Comments
No comments yet