
Medline (MDLN) Faces Bearish Continuation as Shares Fall 3.99% and 3.29%; Fibonacci 61.8% Support at $39 in Focus
Candlestick Theory
Medline (MDLN) has exhibited bearish price action over the past two sessions, with a 3.99% decline on 2026-01-05 and a 3.29% drop on 2026-01-02, forming a series of lower highs and lower lows. The recent candlesticks suggest a potential bearish continuation pattern, with key support levels emerging at $39 (2026-01-05 close) and $38.93 (2026-01-05 low). Resistance is likely to be found near $42 (2025-12-31 close) and $43.08 (2025-12-30 high). A potential bullish reversal could occur if price retests the $39 support level with a higher close, forming a 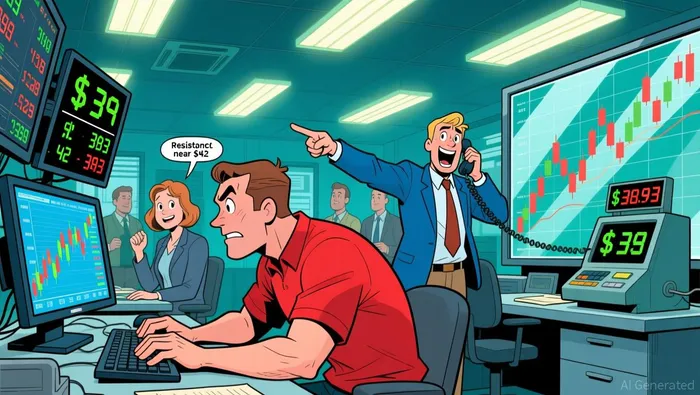 hammer or "inverted hammer" pattern, though confirmation remains pending.
Moving Average Theory
Short-term and long-term moving averages indicate a bearish bias. The 50-day moving average is estimated to be above the current price of $39, given the recent sharp decline, while the 200-day moving average likely remains elevated, reflecting the broader downward trend. The 100-day moving average may also be bearishly aligned, with price action consistently below these key averages. A crossover of the 50-day below the 200-day (death cross) is probable, reinforcing the bearish momentum. However, a sustained rally above the 50-day moving average could signal short-term indecision in the trend.
MACD & KDJ Indicators
The MACD histogram has contracted as the downtrend persists, suggesting weakening bearish momentum. The KDJ (Stochastic) indicator shows oversold conditions, with the K line below the D line and both nearing the 20 threshold. This may indicate a potential short-term bounce, though divergence between the KDJ and price action—such as a higher K line without a corresponding price rebound—could signal a false recovery. The RSI (discussed separately) may corroborate overbought/oversold conditions, but a sustained break below 30 would heighten bearish signals.
Bollinger Bands
Volatility has expanded as the price approaches the lower Bollinger Band, with the current close at $39 nearing the band's lower boundary. Band contraction earlier in December 2025 suggested a consolidation phase, but recent expansion reflects heightened volatility. If the price remains below the 20-period Bollinger Band, it may indicate a continuation of the downtrend. Conversely, a break above the middle band (20-period moving average) could signal a temporary reversal, though this would require confirmation from other indicators.
Volume-Price Relationship
Trading volume has surged during the recent decline, with 9.79 million shares traded on 2026-01-05 and 7.35 million on 2026-01-02, validating the bearish momentum. However, volume spikes on 2025-12-26 (21.09 million) and 2025-12-19 (16.95 million) coincided with significant price drops, suggesting institutional selling pressure. A sustained increase in volume during a rebound could signal distribution, whereas low-volume rallies may indicate weak conviction.
Relative Strength Index (RSI)
The 14-period RSI has likely fallen below 30, confirming oversold conditions. While this may suggest a short-term correction, the RSI remains within a bearish context as long as the broader trend persists. A sustained close above 50 would be required to validate a meaningful reversal, though traders should remain cautious of extended periods in the oversold zone, which are common in strong downtrends.
Fibonacci Retracement
Fibonacci retracement levels drawn from the peak of $45.50 (2025-12-26) to the trough of $34.89 (2025-12-17) highlight critical support/resistance levels. The current price of $39 aligns with the 61.8% retracement level, a key area where a bounce or breakdown could occur. A break below this level may target the 78.6% retracement at $36.77, while a rebound above the 50% level at $40.19 could indicate a temporary pause in the decline. Confluence between Fibonacci support and other indicators, such as the Bollinger Band, strengthens the case for a near-term reversal.
If I have seen further, it is by standing on the shoulders of giants.
Latest Articles
Stay ahead of the market.
Get curated U.S. market news, insights and key dates delivered to your inbox.
AInvest
PRO
AInvest
PRO
Comments
No comments yet