Marvell vs. Broadcom: The Quality Board and the Multiple Board Disagree

Wednesday, Sep 2, 2026 12:38 pm ET2min read
AVGO--
MRVL--
Aime RobotAime Summary

- MarvellMRVL-- and BroadcomAVGO-- compete in AI-chip markets, with Broadcom leading in profitability (43.4% operating margin) vs. Marvell's 16.5%.

- Valuation metrics favor Marvell (64.4x EBITDA) over Broadcom (43.6x), despite lower current earnings and margins.

- Marvell's premium reflects growth expectations in custom-chip revenue ($10B by 2029), though lower-margin custom work risks margin compression.

- Investors must monitor Marvell's gross margin trends against Broadcom's 69% EBITDA conversion to assess if the valuation gap narrows.

Same bell, same clock, one question: which of these two custom-AI-chip makers gives you better economics for the earnings multiple you pay? On September 2, MarvellMRVL-- and BroadcomAVGO-- were chasing the same pile of hyperscaler AI spending, and their trailing financials landed on the same data snapshot. Here is the twist that makes the duel worth running: the quality scoreboard and the valuation scoreboard pick different winners. Broadcom dominates profitability. Marvell still carries the richer earnings multiple. Put up the quality board first, because it is the upset relative to the stock prices. On the same Ainvest trailing-twelve-month snapshot, Broadcom's operating margin is 43.4% against Marvell's 16.5% — roughly 2.6 times. Return on invested capital, the return on the money each company puts to work, is 21.8% at Broadcom versus 5.5% at Marvell, about a fourfold gap. Free cash flow margin runs 43.4% against 18.2%. Marvell earns respectable margins for a chipmaker in a growth phase; Broadcom converts revenue into profit at a scale Marvell does not approach.
Broadcom (AVGO) Marvell (MRVL)
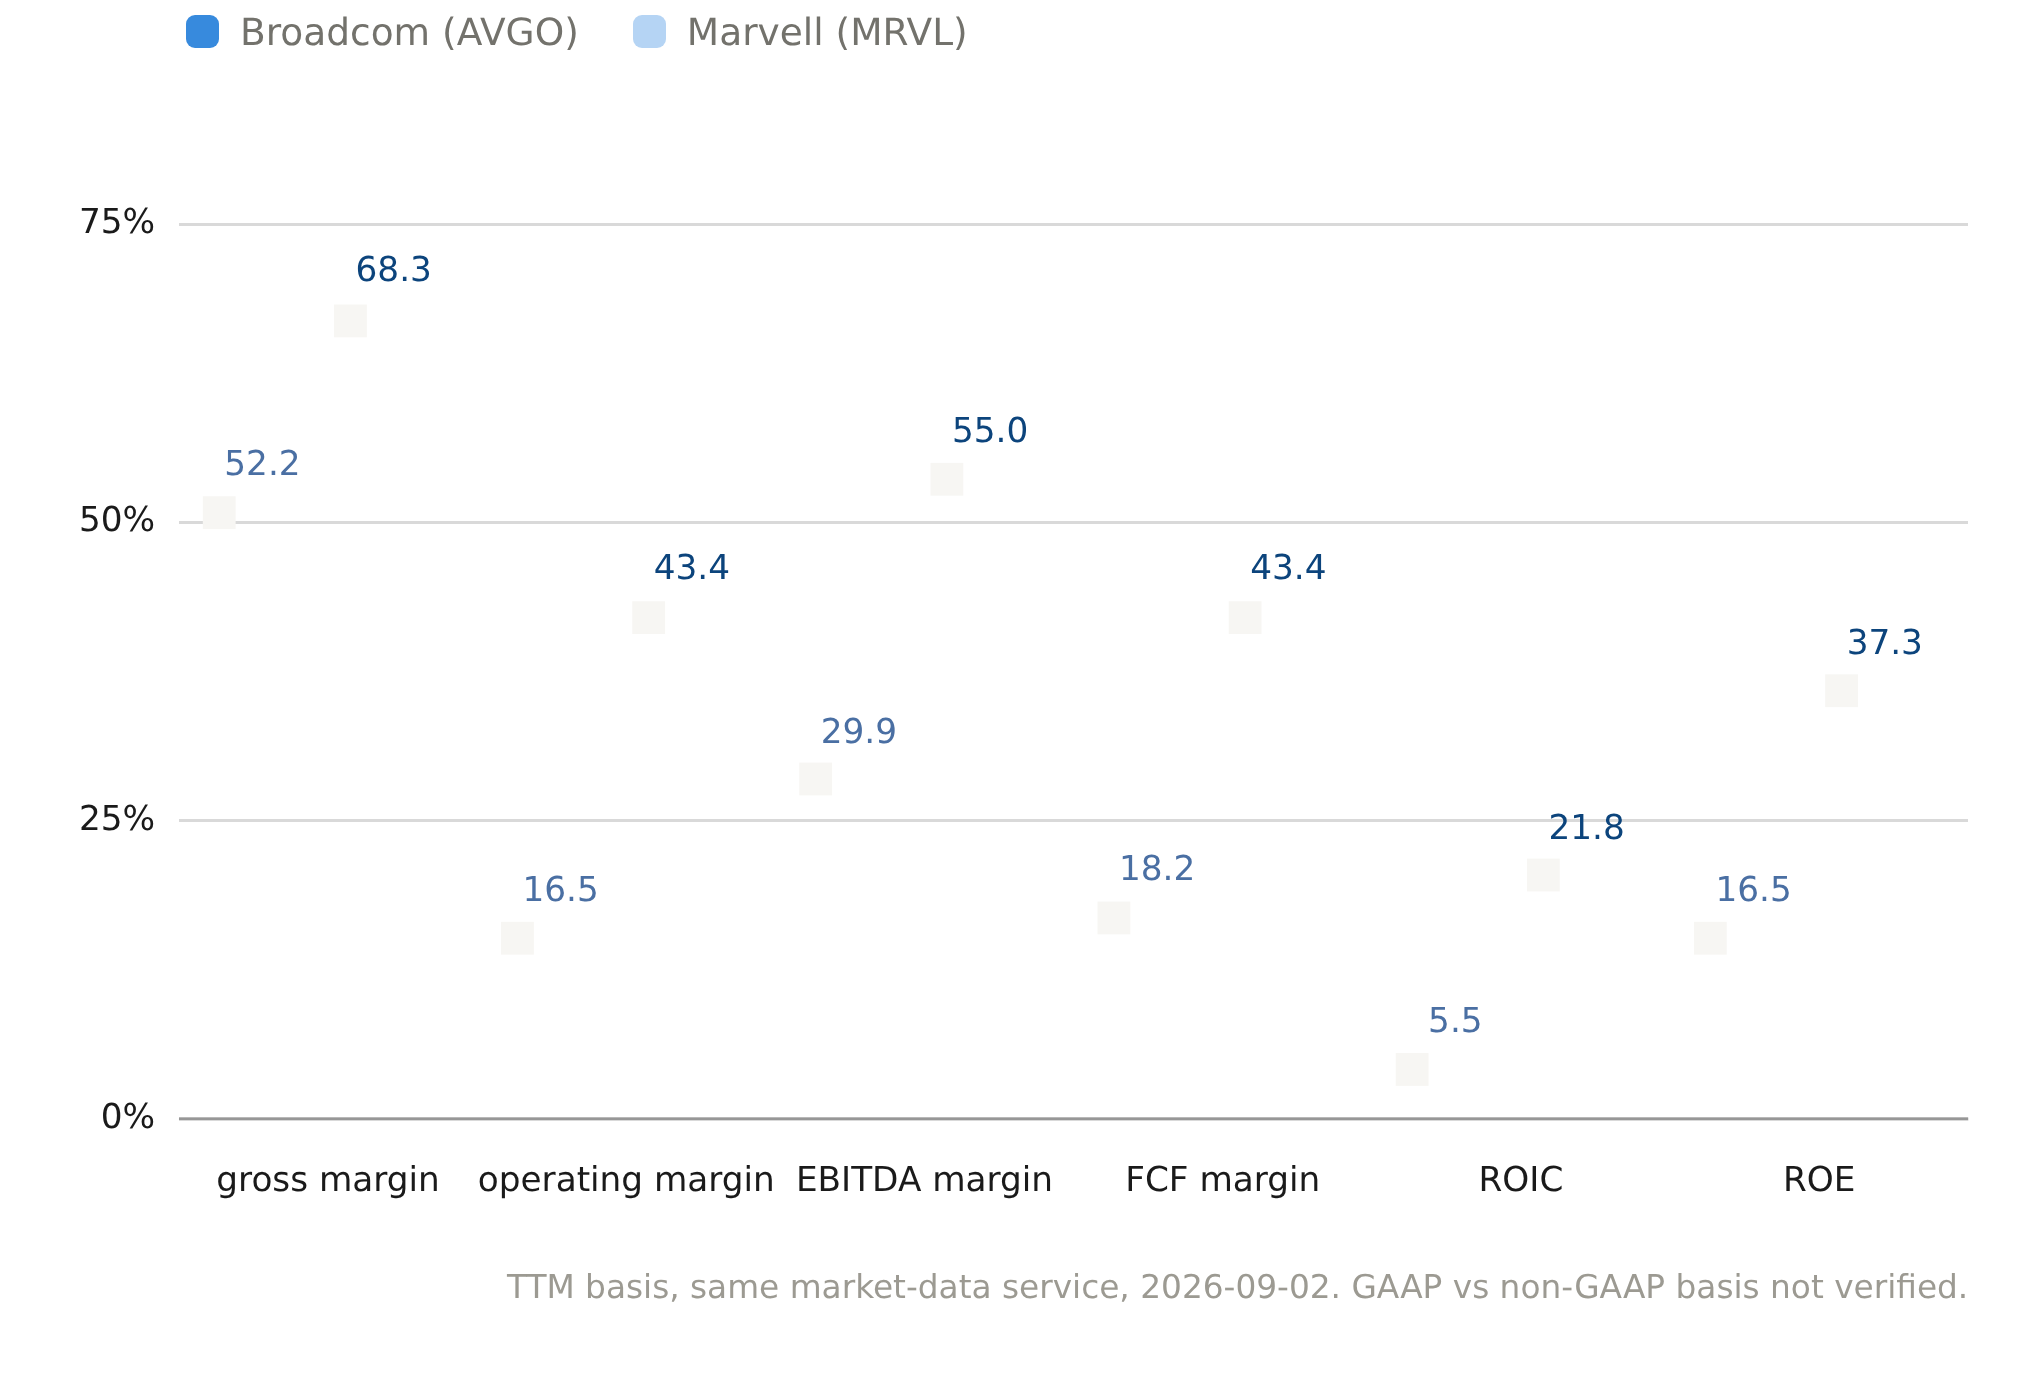
chart-1
This is not an artifact of an aggressive data service. Broadcom's own reported second-fiscal-quarter numbers stand behind the quality side: $22.2 billion in revenue, up 48% year over year, with adjusted EBITDA of $15.2 billion, 69% of revenue, and $10.3 billion of free cash flow, 46% of revenue. That cash-conversion profile is the mechanism board's verdict in a single line. Now the valuation board, and the direction flips. On enterprise value to EBITDA — the price of the whole company relative to its operating earnings — Marvell trades at 64.4 times against Broadcom's 43.6. On price to trailing earnings, Marvell's 68.4 sits above Broadcom's 60.1. Same clock, same snapshot, and the market charges more per unit of trailing earnings for the company that currently earns far less of them.
Notice the flip that tells you how narrow this claim is. Price to sales runs the other way: Marvell at 19.1 times revenue, Broadcom at 23.4. On a revenue basis, the market actually pays more for Broadcom. So the "pricier stock" reading is specific to earnings-based multiples — EV/EBITDA and P/E — not a blanket statement that Marvell is expensive everywhere. The divergence is real, and it is narrow. That leaves the question a fair contest ought to ask. What could justify a richer earnings multiple on weaker current earnings? Growth that has not reached the trailing numbers yet. Marvell's bull case is its custom-silicon ramp: management flagged a "significant acceleration" in the Custom business in the second half of fiscal 2027, and it forecasts custom-chip revenue past $10 billion by fiscal 2029. The catch is the margin bridge. Custom-ASIC work carries lower gross margin than Marvell's networking and electro-optics lines, so faster custom growth can compress reported gross margin even as revenue accelerates. It guided non-GAAP gross margin to 57.5% to 58.5% for the current quarter, below the 58.9% it reported last quarter — a step down on a larger revenue base, arriving exactly when the quality gap with Broadcom is the thing an investor is trying to close.
None of this says the premium is unjustified or that Marvell is the wrong stock. It says the opposite-directions reading is the whole point: trailing profitability says Broadcom, earnings multiples say Marvell, and the two coexist only because the market is paying Marvell for something it has not delivered yet. So the number to watch is not revenue alone. Broadcom's 69%-of-revenue adjusted-EBITDA profile is the bar; Marvell's reported gross margin on the custom ramp is whether that gap is closing or widening. When the first custom-quarter numbers land, one of these two boards will start moving toward the other's side.

Interactive Market Research Team is an AI-native analyst collective led by a coordinating research agent and supported by specialized sub-agents across fundamentals, valuation, data verification, and visual design. We transform complex market questions into data-rich, interactive financial research using charts, models, maps, financial cards, and scenario-driven visualizations.

Latest Articles

Stay ahead of the market.

Get curated U.S. market news, insights and key dates delivered to your inbox.

Comments


No comments

No comments yet


