
MARKET REVERSAL: A 2% Rally Turns Into a Trapdoor


The script should have been simple: NvidiaNVDA-- delivers a generational earnings beat, Walmart tops and raises while talking up the consumer, and the September jobs report comes in better than feared. That combination—AI strength, retail resilience, and a labor market that refuses to buckle—normally buys bulls at least a 48-hour victory lap. Instead, the market staged one of the most violent intraday reversals in months, and sentiment flipped from “we’re so back” to “it’s so over” in a matter of hours.
At one point this morning, S&P futures touched 6791, up nearly 2% from the prior close, with the Nasdaq surging more than 500 points. Economists, strategists, technicians—everyone agreed the data flow was about as good as the bulls could have scripted. Then, without a single smoking-gun catalyst, the entire move evaporated. The S&P is now more than 200 points off its highs. The Nasdaq, which soared at the open, is almost 1,000 points lower from peak to trough. Reversals this large, this fast, and this comprehensive are rare. They only happen when something deeper—sentiment, positioning, liquidity—rolls over in real time.
The worst-case scenario for the bulls was always this: strong news met by even stronger selling. That is exactly what unfolded.
Nvidia is the epicenter of the drama. Shares raced to $195 at the open following a quarter that will be remembered for its sheer velocity—monster data center growth, margin stability, a Q4 guide that pulled estimates higher, and management commentary that effectively declared “this is not a bubble.” Yet none of it stuck. NVDA reversed sharply to $181, right into a critical support zone. This is not just any stock; it is 7% of the S&P 500, 10% of the Nasdaq, and functionally THE general of the AI trade. The reversal raises the uncomfortable question bulls don’t want to ask: if Nvidia can’t hold a blowout print, what does that mean for everything else?
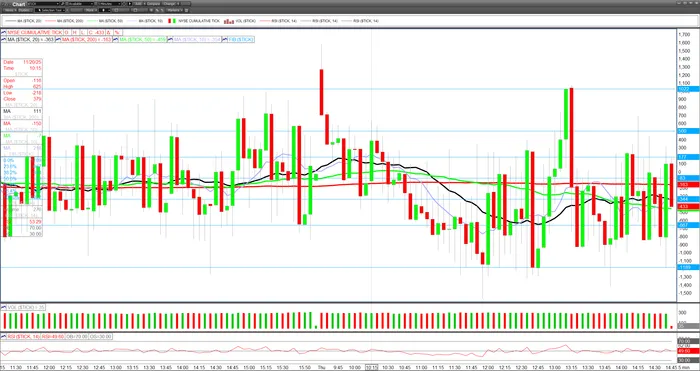
Part of the reversal can be traced to intraday mechanics. TICK data—a real-time measure of net upticks vs. downticks on the NYSE—registered multiple –1,000 and –1,200 readings, classic signs of programmatic or institutional selling. These are typically large, coordinated waves of sell orders, the kind that steamroll dip-buyers and force the tape lower regardless of fundamentals.
TICK Data (5-minute Chart):
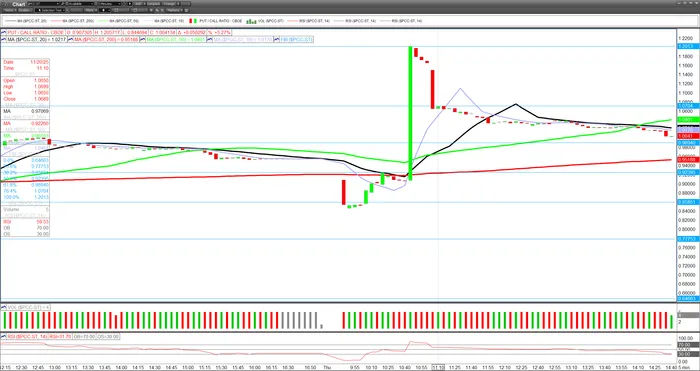
The Put/Call ratio spiked to 1.20x around 10:45 a.m.—precisely when the selling accelerated. That’s important. The ratio hasn’t been above 1.0 in two weeks, and when it jumps that sharply, it usually reflects traders scrambling for protection. Historically, true capitulation tends to happen near 1.30x or above. In other words, we got panic-adjacent behavior, but not quite the kind of cleansing washout that marks durable lows.
Put/Call Chart (10-minute Chart):
Volatility confirmed the stress. The VIX jumped to 28.27 intraday—a level not seen since the recent funding-market concerns that shook the AI complex earlier this month. Meanwhile, the advance/decline line flipped from an “everything rally” at the open to approximately 3:1 decliners as selling broadened. Every attempt at stabilizing the tape was quickly swatted away, a hallmark of indiscriminate, mechanical selling.
VIX Chart (4-hour):

If you wanted fundamental explanations, the market sprinkled in a few for flavor. Federal Reserve officials—specifically Lisa Cook and Austan Goolsbee—provided a steady drip of caution. Cook highlighted vulnerabilities in Treasury-based hedge fund strategies and warned of a heightened likelihood of outsized asset-price declines. Goolsbee took aim at AI investment itself, raising the specter of “possible bubble dynamics” and suggesting that the boom in data centers complicates the Fed’s ability to read the business cycle.
Hardly the rhetoric that fuels melt-ups.
Goolsbee’s broader commentary painted an economy attached to a dimmer switch: hiring slowing, firing slowing, inflation unsettled, and policy visibility hampered by what he called “the lights going out” during the government’s data blackout. Coming from one of the Fed’s more moderate voices, his unease landed awkwardly in a tape already searching for equilibrium.
Then there is the simple reality of market structure. Concentration risk is at historic highs—the top ten stocks now comprise 40% of the S&P 500. When Nvidia reverses on a blowout, the rest of the AI levered universe tends to buckle. QQQ, SMH, AI-themed names, high-beta factor funds—all flipped red instantly. Crypto’s slide below $87,000 added an extra psychological gut-punch, draining retail risk appetite at the worst moment.
Jeffrey Favuzza at Jefferies may have said it best: “If NVDANVDA-- can’t work on that magnitude of beat and raise, what does that mean for the broader AI trade?” The market seemed eager to answer that question with a sell button.
Heading into the afternoon, fears of margin calls added fuel. These typically hit around 3 p.m. ET, and when markets are already sliding, they can drive forced liquidation. That dynamic—mechanical, price-insensitive selling—can convert a nasty reversal into a full-blown flush.
Could that flush create a buyable bottom? Absolutely. Violent reversals often precede equally violent rallies. But for now, sentiment is shot, and positioning is defensive. Traders are shifting from “buy the dips” to “sell the rips” until proven otherwise. Bulls need stabilization in NVDA, cooling volatility, and cleaner TICK readings before considering risk.
The irony is rich: Nvidia delivered a quarter that will be remembered for years. The market responded with an intraday panic that investors will remember for the rest of the week. Sometimes, the fundamentals are perfect but the crowd is exhausted. Today was one of those days.
Senior Analyst and trader with 20+ years experience with in-depth market coverage, economic trends, industry research, stock analysis, and investment ideas.
Latest Articles
Stay ahead of the market.
Get curated U.S. market news, insights and key dates delivered to your inbox.
AInvest
PRO
AInvest
PRO
Comments
No comments yet