
Market Overview for Yield Guild Games/Tether (YGGUSDT) on 2025-12-07


Summary
• YGGUSDT formed bearish engulfing and dark cloud cover patterns near 0.075–0.076.
• Momentum weakened as RSI dropped below 50 and MACD turned bearish.
• Volatility expanded with a move beyond the upper Bollinger Band at 0.0765.
• Volume surged during the breakdown below 0.075, confirming bearish conviction.
• Fibonacci 61.8% support at 0.0745 was tested, but not decisively held.
The pair opened at 0.0746 and peaked at 0.0774 before closing at 0.0728 in New York time. Total 24-hour volume reached 10.1 million, with turnover hitting $736,661.
Structure and Candlestick Patterns
A bearish engulfing pattern formed near 0.076 as price dropped from 0.0766 to 0.0756. Later, a dark cloud cover at 0.0758–0.0755 confirmed bearish sentiment. A doji formed near 0.075, signaling indecision before a sharp decline.
**
Moving Averages and Momentum
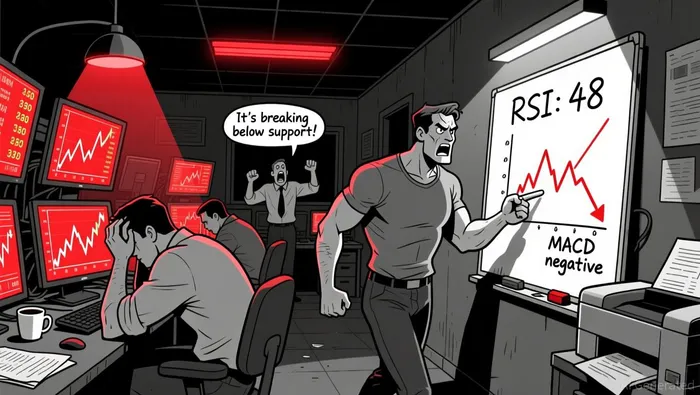
On the 5-minute chart, the 20-EMA crossed below the 50-EMA, reinforcing bearish momentum. RSI fell below 50 and approached oversold territory, while MACD turned negative, indicating waning buying pressure.
Bollinger Bands and Volatility
Price expanded beyond the upper band at 0.0765 in the morning before collapsing within the lower band by the afternoon. The widening of the bands highlighted growing uncertainty.
Volume and Turnover Analysis
Volume spiked during the breakdown below 0.075, aligning with price action. The largest single candle (14:30 ET) saw $199,585 in turnover as price fell from 0.0716 to 0.0704.
Fibonacci Retracements
Price briefly found support at the 61.8% level of the 0.076–0.072 swing at 0.0745 but failed to rebound decisively. The 38.2% level at 0.0736 now appears key for near-term direction.
YGGUSDT appears to be consolidating below 0.0735, with bearish momentum intact. A retest of 0.0745 could trigger a bounce, but a sustained close below 0.073 may invite further selling. Investors should monitor the 0.0725–0.073 level for signs of a potential reversal or continuation.
Decoding market patterns and unlocking profitable trading strategies in the crypto space
Latest Articles
Stay ahead of the market.
Get curated U.S. market news, insights and key dates delivered to your inbox.


AInvest
PRO
AInvest
PRO
Comments
No comments yet