
Market Overview for XRP/Tether (XRPUSDT) on 2026-01-16
Summary
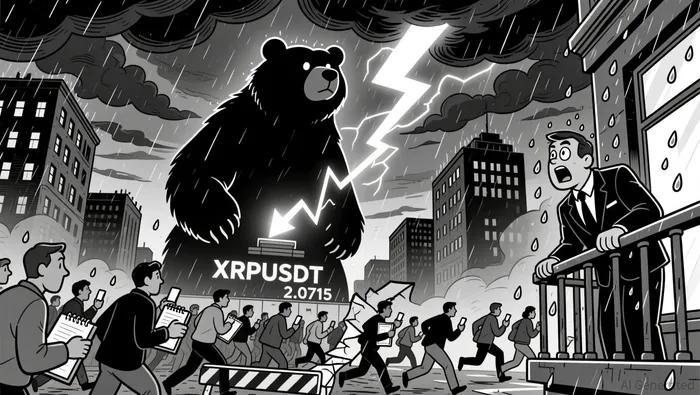
• XRPUSDTXRP-- declined from 2.0967 to 2.0652 over 24 hours, with a bearish breakdown below key support.
• Momentum weakened as RSI dipped into oversold territory, while volume surged at key price levels.
• A bearish engulfing pattern formed near 2.0715, suggesting potential for further downside.
At 12:00 ET−1 on 2026-01-16, XRP/Tether (XRPUSDT) opened at 2.0885, reached a high of 2.0967, and closed at 2.0652 by 12:00 ET, with a low of 2.0300. Total volume was 55.8 million XRPXRP--, and notional turnover was $11.5 million over the 24-hour window.
Structure & Formations
The price action on XRPUSDT shows a bearish breakdown below the 2.0715 support level, confirmed by a bearish engulfing pattern. A key resistance level appears to form at 2.079–2.081, while support levels cluster around 2.060–2.065 and 2.050–2.055. A large bearish candle at 19:45 ET (2.0583) and a doji near 00:45 ET suggest indecision and potential exhaustion at these levels.
Moving Averages and MACD
On the 5-minute chart, the 20-period and 50-period moving averages are bearishly aligned, with price below both. The MACD turned negative and shows diverging bearish momentum, reinforcing the downward bias. On daily timeframes, the 50/100/200 MA lines are not fully visible in the data but would likely show bearish alignment if recent trends continue.
RSI and Bollinger Bands
RSI fell into oversold territory near 28, suggesting potential for a rebound or consolidation. However, without a strong bullish reversal, the downtrend may continue. Bollinger Bands widened as the price dropped sharply below 2.070, indicating increased volatility. Price currently rests near the lower band, suggesting a possible bounce or continuation of the downtrend.
Volume and Turnover
Volume spiked significantly at key turning points: near 19:45 ET, 03:30 ET, and 15:30 ET, confirming bearish breakdowns. Turnover also increased during these periods, reinforcing the strength of selling pressure. However, a divergence appears at 04:45 ET—price continued down while volume dipped—hinting at potential exhaustion.
Fibonacci Retracements
Applying Fibonacci to the recent 5-minute swing from 2.0967 to 2.0500, key retracement levels are 38.2% at 2.076 and 61.8% at 2.064. Price has tested the 61.8% level, indicating a potential floor for near-term consolidation.
Looking ahead, XRPUSDT appears to be in a bearish consolidation phase, with the 2.060–2.065 zone as near-term support. Traders should watch for a potential bounce or retest of that level, as well as signs of buying interest above 2.0715. However, without a clear bullish reversal pattern, the bias remains to the downside. As always, volatility and volume changes may drive unexpected moves.
Decoding market patterns and unlocking profitable trading strategies in the crypto space
Latest Articles
Stay ahead of the market.
Get curated U.S. market news, insights and key dates delivered to your inbox.

AInvest
PRO
AInvest
PRO
Comments
No comments yet