
Market Overview: Wrapped Bitcoin/Bitcoin (WBTCBTC) on 2026-01-08
Summary
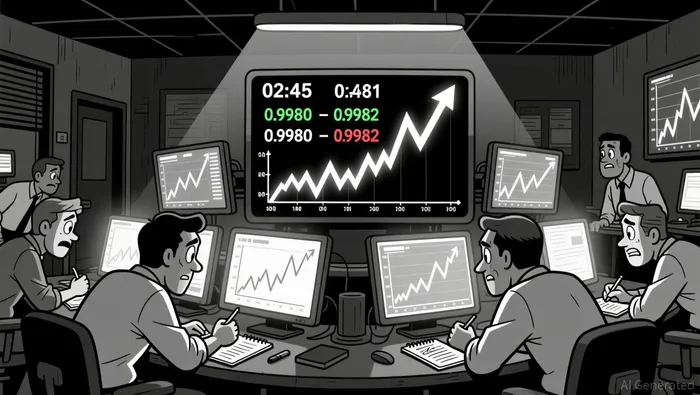
• Price action consolidated near key 0.9980–0.9982 range, suggesting short-term equilibrium.
• Volume surged during overnight hours, hinting at renewed interest or position adjustments.
• No strong overbought/oversold RSI readings suggest sideways bias remains intact.
Wrapped Bitcoin/Bitcoin (WBTCBTC) opened at 0.9981 on 2026-01-07 at 12:00 ET, reached a high of 0.9982, hit a low of 0.9980, and closed at 0.9982 as of 12:00 ET on 2026-01-08. Total 24-hour volume was 12.297 BTC-equivalent, with turnover of 12.245 BTC.
Structure & Formations
Price action remained tightly clustered between 0.9980 and 0.9982, with the 0.9981 level acting as a pivot point. A small bullish engulfing pattern was visible at 02:45 ET, suggesting short-term accumulation. However, the range-bound nature of the session pointed to a lack of directional conviction, with no decisive breakouts.
Moving Averages
On the 5-minute chart, the 20-period and 50-period moving averages were nearly overlapping near 0.9981, reinforcing the tight consolidation. Daily moving averages (50/100/200) showed no divergence, remaining well above the current price level.
MACD & RSI
The MACD line remained below zero with a neutral histogram, indicating no strong momentum in either direction. RSI hovered around 50, consistent with neutral sentiment and no overbought or oversold conditions.
Bollinger Bands
Volatility remained subdued, with price staying near the middle band. No sharp contractions or expansions were observed, though occasional retests of the lower band suggested mild buying interest at 0.9980.
Volume & Turnover
Volume increased significantly overnight, with the 03:45 ET candle showing the highest volume at 0.58894 BTC. Despite this, price failed to make a lasting move above 0.9982, hinting at potential resistance. Turnover closely followed volume trends, showing no major divergences.
Fibonacci Retracements
Applying Fibonacci retracement levels to the recent 5-minute swing (0.9980–0.9982), the 0.9981 level aligned with the 50% retracement. If this level breaks, 38.2% (0.99807) and 61.8% (0.99813) would become relevant as potential support and resistance.
The next 24 hours may bring renewed attempts to test 0.9982 as resistance or a pullback to 0.9980 for support. Investors should remain cautious, as a breakout could trigger a more extended move, while a continuation of consolidation suggests patience is warranted.
Decoding market patterns and unlocking profitable trading strategies in the crypto space
Latest Articles
Stay ahead of the market.
Get curated U.S. market news, insights and key dates delivered to your inbox.

AInvest
PRO
AInvest
PRO
Comments
No comments yet