
Market Overview for Wormhole/Tether (WUSDT) on 2026-01-14
Summary
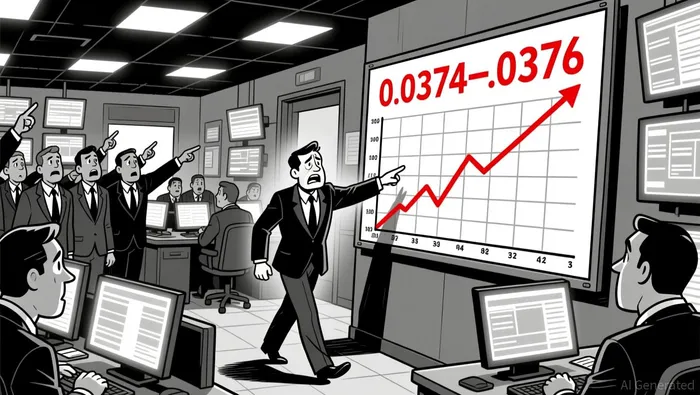
• Price tested key support near 0.0374–0.0376 before rebounding and reaching a high of 0.0403.
• A sharp volume spike confirmed the midday breakout but failed to maintain momentum above 0.0392.
• RSI showed overbought conditions during the peak rally, while Bollinger Bands widened, indicating heightened volatility.
• A bearish engulfing pattern formed around 0.0388–0.0386, hinting at potential bearish continuation in the short term.
• Turnover peaked during the breakout but has since declined, suggesting possible exhaustion of buying pressure.
WUSDT opened at 0.0375 on 2026-01-13 at 12:00 ET, reached a high of 0.0403, tested support near 0.0374, and closed at 0.0389 on 2026-01-14 at 12:00 ET. Total 24-hour volume was approximately 35.8 million units, with a notional turnover of $1.35 million.
Structure & Candlestick Patterns
The price formed a strong bullish impulse from 0.0374–0.0386, followed by a bearish engulfing pattern near 0.0388–0.0386. This pattern suggests a potential shift in sentiment. A doji appeared near 0.0387–0.0388, signaling indecision, while 0.0374–0.0376 acted as a key support level during the selloff.
Moving Averages and MACD
On the 5-minute chart, the price briefly crossed above both 20 and 50-period moving averages before retracting. The MACD showed a bullish divergence early in the session, followed by bearish divergence toward the close. The RSI peaked above 70, indicating overbought conditions, which failed to confirm strong continuation.
Bollinger Bands and Volatility
Bollinger Bands expanded significantly during the midday breakout, with the price reaching near the upper band at 0.0403. The subsequent pullback brought the price back into the mid-band range, suggesting some consolidation. The expansion in band width reflects rising volatility and uncertainty in the near term.
Volume and Turnover Analysis
Volume spiked dramatically during the breakout to 0.0403, reaching 12.15 million units in a single 15-minute window, but declined afterward. Notional turnover mirrored this pattern, with the highest turnover recorded at $47,578.53 in that same period. The divergence between rising price and tapering volume raises questions about the sustainability of the upward move.
Fibonacci Retracements
Applying Fibonacci retracements to the key 0.0374–0.0403 swing, price retraced to the 61.8% level near 0.0388–0.0389 before showing signs of bearish pressure. The 38.2% level at 0.0394 may act as a potential resistance zone for the next 24 hours.
In the near term, WUSDTLA-- appears poised for a test of support at 0.0374–0.0376, with a possible retest of the 0.0389 level. Investors should remain cautious as divergence in momentum indicators and declining volume suggest a potential pause in the current trend. A break below 0.0374 could open the door to further downside, while a sustained move above 0.0392 may rekindle bullish sentiment.
Descifrar los patrones del mercado y desarrollar estrategias de trading rentables en el ámbito de las criptomonedas.
Latest Articles
Stay ahead of the market.
Get curated U.S. market news, insights and key dates delivered to your inbox.


Comments
No comments yet